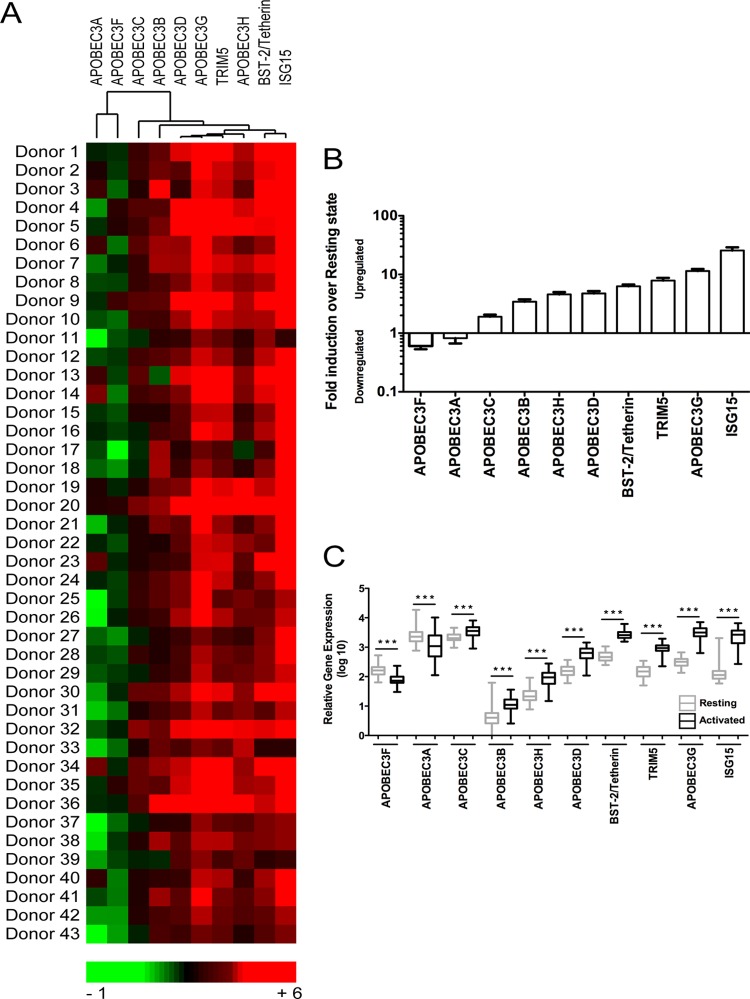
Fig 1.
Host antiviral gene expression analysis in resting and activated PBMC. PBMC (n = 43) from the same blood donor were left untreated or were PHA-P (5 μg/ml) activated for 1 day. RNA was extracted using TRIzol followed by cDNA synthesis. Quantitative real-time PCR was performed using custom-made TaqMan low-density arrays (TLDA). A panel of 6 housekeeping genes was included in the TLDA plates, and PPIA was identified as the most stably expressed gene and was used for normalization of results by the comparative CT method. All gene cards (Applied Biosystems) used for quantification are depicted in Table S1 in the supplemental material. (A) Heat map depicting fold induction of antiviral gene expression following activation. (B) Ascending fold changes in gene expression. Bars represent means + standard errors of the means (SEM) of antiviral gene expression determinations for a total of 43 donors. (C) Comparative analysis of antiviral gene expression in resting and activated donor cells. Statistical analysis was performed using the Mann-Whitney test (***, P < 0.001).

