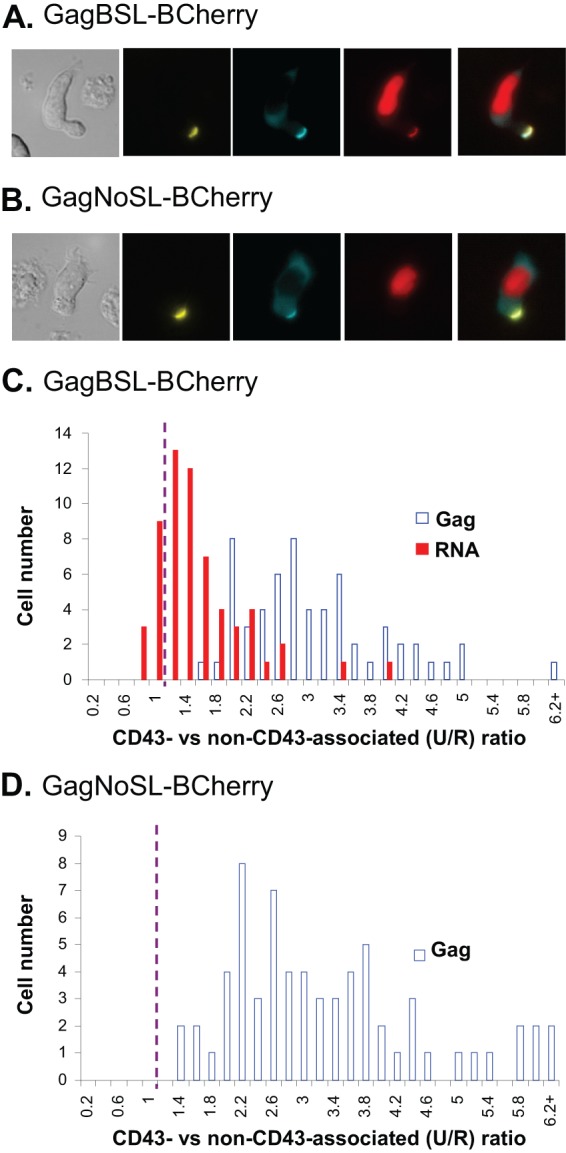
Fig 2.

Subcellular distribution of the HIV-1 Gag and full-length RNA in polarized T cells. (A and B) Representative images of polarized T cells expressing GagBSL-BCherry (A) or GagNoSL-BCherry (B). Images were analyzed using Nikon Elements software, in which the sum intensities were measured using three regions of interests (ROIs): one around the CD43-stained region of the cell denoting the uropod; a second around the CD43-negative part of the cell; and a third around the nucleus. (C and D) The sum intensities were normalized to the area and then used to calculate the signal intensity per pixel near the uropod membrane (CD43-associated or U) and the signal intensity per pixel for the rest of the cytoplasm and plasma membrane (non-CD43-associated or R). When the signals are enriched near the uropod membrane, the U/R ratios are greater than 1. The distributions of Gag and RNA signals are summarized from cells expressing GagBSL-BCherry (C) and GagNoSL-BCherry (D). As a significant cytoplasmic mCherry signal was not detected in the GagNoSL-BCherry-expressing cells, only the distribution of the Gag U/R ratio is summarized in panel D. Data shown represent 60 cells collected from 7 experiments (C) and 66 cells collected from 8 experiments (D).
