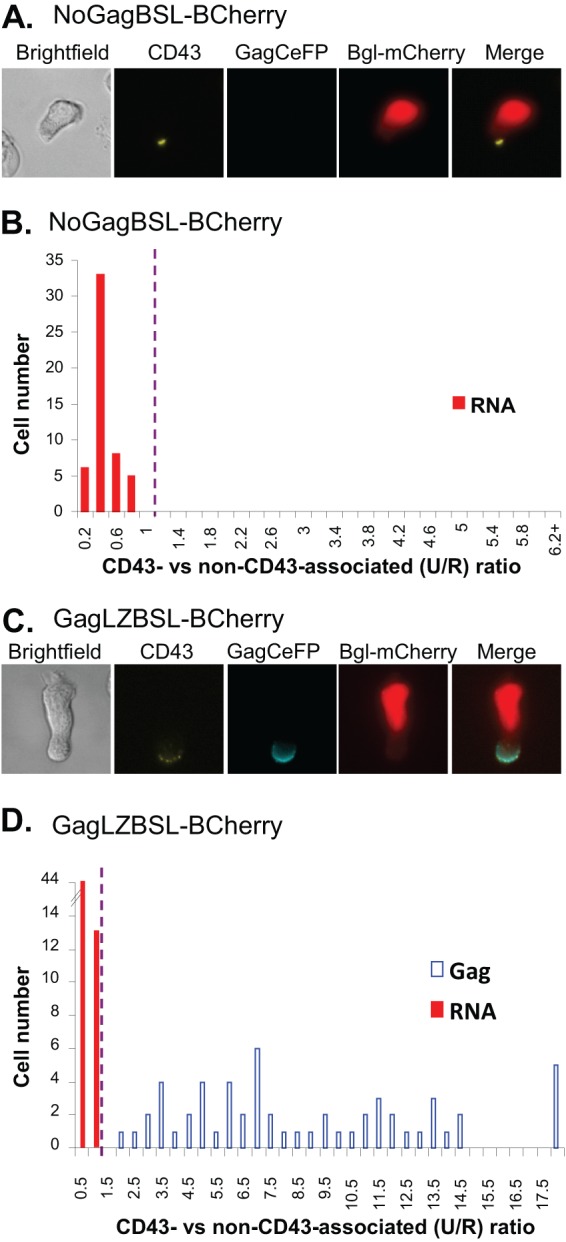
Fig 3.

Subcellular distribution of the HIV-1 full-length RNAs of Gag mutants in polarized T cells. (A and C) Representative images of polarized T cells expressing NoGagBSL-BCherry (A) or GagLZBSL-BCherry (C). (B and D) The distributions of Gag and RNA signals summarized from 5 experiments with 52 cells expressing NoGagBSL-BCherry (B) and 8 experiments with 57 cells expressing GagLZBSL-BCherry (D) are shown. Calculations and abbreviations are the same as described for Fig. 2.
