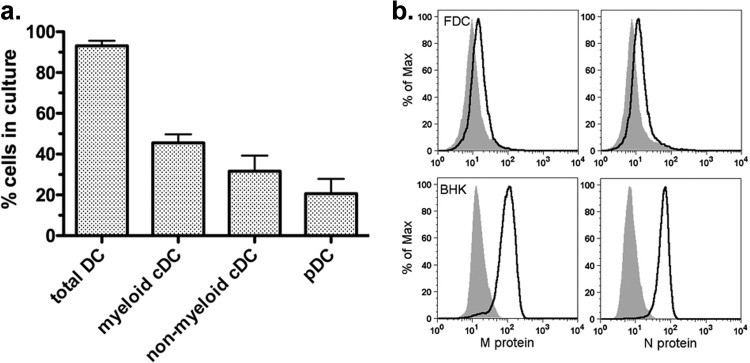
Fig 1.
Phenotype of Flt3L DC (FDC) and infection with wt VSV. (a) FDC cultured as described in Materials and Methods were stained for cell surface markers to determine DC subtype composition. Total DC were defined as CD11c+ cells, myeloid cDC were defined as CD11c+ CD11bhigh, pDC were defined as CD11c+ B220+ CD11blow/−, and nonmyeloid cDC were defined as CD11c+ CD11blow/− B220−. Results are expressed as percentage of each cell type in the culture (mean ± SD; n = 7). (b) Graphs depicting mock-infected FDC (gray shaded areas) and wt-VSV-infected FDC (solid lines). At 12 h, the cells were stained for intracellular VSV M and N proteins by 2-step immunofluorescence. Results for BHK cells infected and stained in the same manner are depicted as a positive control. Data for one of 2 independent experiments with similar results are shown.

