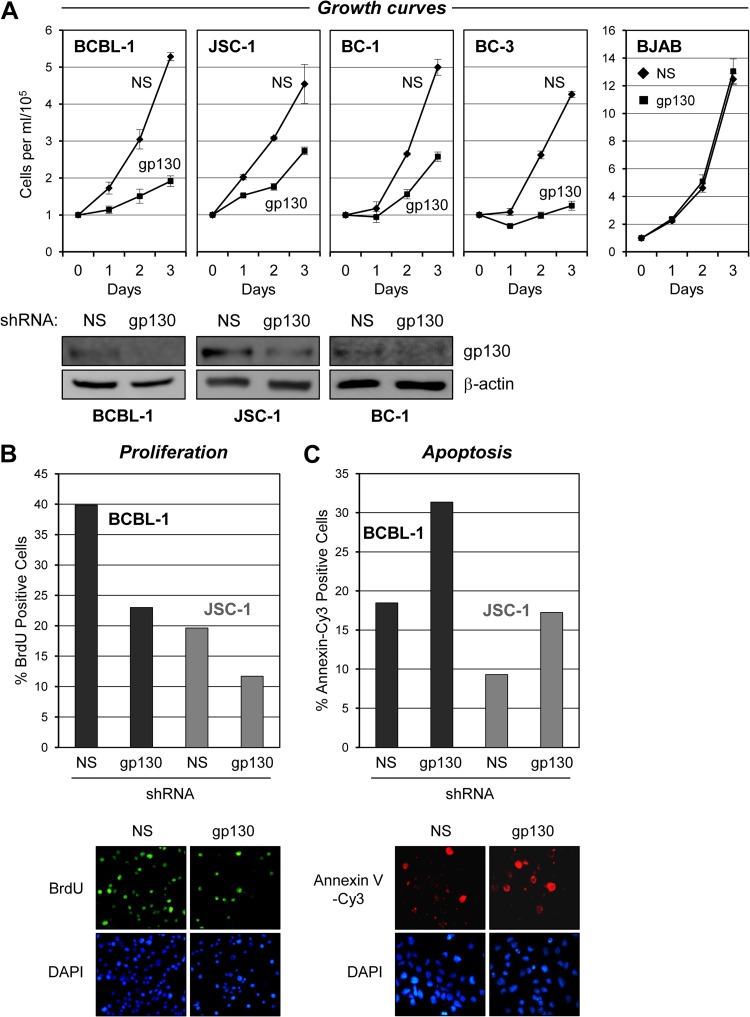
Fig 1.
Effects of gp130 depletion on PEL cell growth and viability. (A) BCBL-1, JSC-1, BC-1, and BC-3 PEL cells and HHV-8-negative BJAB B cells were transduced either singly (BCBL-1, JSC-1, and BJAB) or dually (BC-1 and BC-3) with gp130-directed shRNA(s) by lentiviral infection (see Materials and Methods). Appropriate high-efficiency infection with the GFP-positive lentiviral vectors was evidenced by >90% GFP fluorescence in the cultures, which was sustained over the course of the 3-day growth experiment. Cell growth assays were initiated following cell density normalization and seeding of cells into fresh medium 48 h after lentiviral infection. Growth of the cultures was quantified by daily counting of trypan blue-excluding (viable) cells per ml with a hemocytometer. Cultures transduced with equivalent titers of a lentiviral vector expressing NS shRNA were used as controls. Triplicate cultures were infected with lentiviral vectors and monitored for growth. Error bars represent divergence from mean values determined for the triplicate cultures. Western blotting of cell lysates derived from pooled cultures at the end of the growth experiment (on day 3) was carried out to verify gp130 depletion; the respective blots are shown below the associated growth curves. For BC-3 cells, complete cytostatic effects of gp130 shRNA transduction resulted in insufficient cell numbers to process for immunoblotting. Levels of gp130 in BJAB cell lysates were below the limit of detection; the growth data show a lack of general cytostatic effects of lentivirus-mediated gp130 shRNA transduction. (B) Samples of gp130 and NS shRNA-transduced BCBL-1 and JSC-1 cultures harvested on day 2 from the growth curve experiments shown in panel A were analyzed for proliferation. Rates of proliferation were determined by detection of BrdU incorporation over a 2-h period into newly synthesized DNA with Alexa Fluor 488-conjugated, BrdU-specific antibody for immunofluorescence visualization of S-phase cells and counterstaining with DAPI to detect all nuclei. Relative proliferation rates are shown as the percentages of cells in S phase (BrdU positive) in the respective cultures. Data were derived from two random fields (>100 cells/field) of each slide-spotted culture sample. Examples of BrdU and DAPI costaining (sections of a single field, BCBL-1 cells) are shown below the quantified data. (C) Rates of apoptosis in these same PEL cell cultures were determined by annexin V-Cy3 binding. DAPI staining was again used to visualize nuclei, enabling calculation of the percentage of cells undergoing apoptosis. Examples of annexin V-Cy3 and DAPI costaining (of JSC-1 cells) are shown below the graphs. Cells were harvested on day 3 for the apoptosis assays.

