Fig 3.
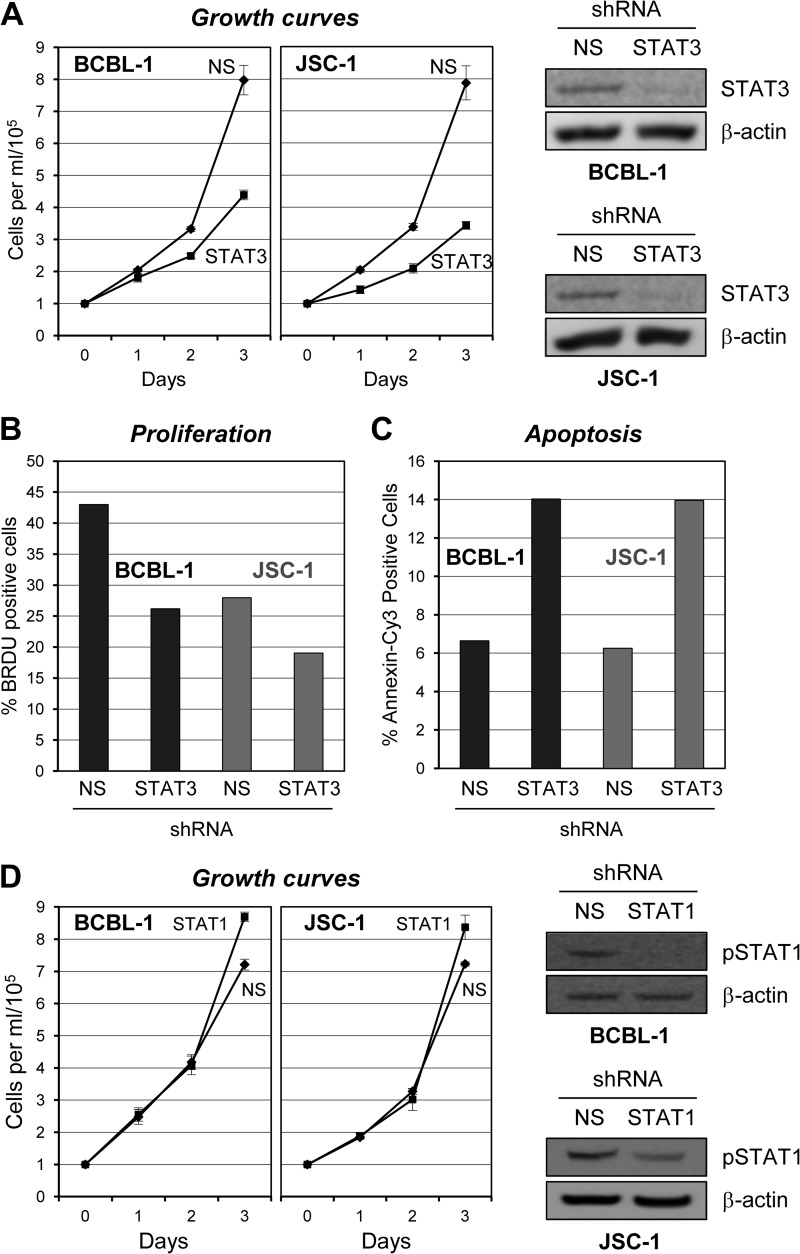
Contributions of gp130-activated STATs to PEL cell growth. (A) Appropriate lentiviral shRNA vectors (see Materials and Methods) were used in combination to infect BCBL-1 and JSC-1 PEL cells to deplete STAT3. Control cultures were infected with an equivalent dose of lentivirus encoding NS shRNA. Efficient lentiviral transduction of the respective cultures was verified by UV microscopy for the detection of lentiviral vector-expressed GFP; >90% of the cells in each culture were transduced with the STAT3-directed or NS shRNA-expressing vectors. Cells were allowed to rest for 2 days posttransduction, normalized to a cell density of 105/ml, and monitored for cell growth as outlined in the Fig. 1 legend. Growth curves were derived from triplicate cultures transduced separately with the NS and STAT3-targeting lentiviral shRNA vectors and monitored in parallel. Error bars represent deviations from the mean cell density at each 24-h time point over the 3-day experiment. Pooled cultures were harvested at the end of the experiment (day 3) for Western analysis of cell lysates to check for depletion of STAT3. (B) Proliferation of STAT3-depleted versus NS shRNA-transduced BCBL-1 and JSC-1 cells was examined by BrdU incorporation assay of cells harvested on day 3 (5 days after shRNA transduction) as outlined in the legend to Fig. 1. (C) Rates of apoptosis in these same culture samples were determined by annexin V-Cy3 binding assays and costaining of cell nuclei with DAPI (see above, Fig. 1 legend). (D) STAT1 depletion experiments were performed to examine the potential contributions of STAT1 to BCBL-1 and JSC-1 cell growth. STAT1 depletion was mediated by infection of PEL cell cultures with a lentiviral vector encoding a STAT1 mRNA-targeting shRNA (see Materials and Methods), and NS shRNA-encoding lentivirus was used as a control as before. While substantial depletion of STAT1 was apparent for each cell line (immunoblots, right), the growth of neither was altered significantly as a result. Chemiluminescence signals in Western blot assays were digitally captured, quantified with imager-associated software, and normalized to the β-actin signal. The pSTAT1 levels in JSC-1 cultures were 1.9-fold lower than those in the corresponding NS shRNA-transduced controls; no pSTAT1-specific signal was detected in BCBL-1 cell lysates from STAT1 shRNA-transduced cultures.

