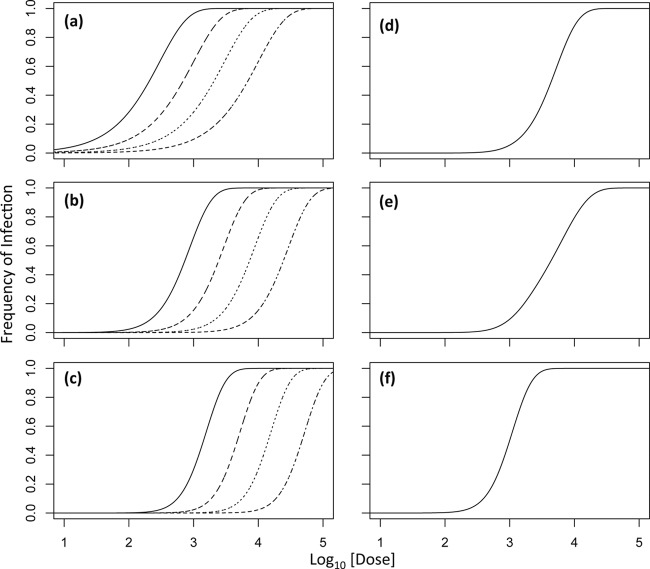
Fig 1.
Infection model predictions. In all of the panels, the log10-transformed dose is on the abscissa (where the dose is the sum of the doses of each type of virus particle) and the infection frequency is on the ordinate. In panel a, predictions of the infection model for a virus with one genome segment (k = 1; IAH) are shown, with infection probabilities decreasing from 3.3 × 10⁻³ to 1 × 10⁻³ to 3.3 × 10⁻⁴ to 1 × 10⁻⁴ for the curves from left to right (the grain of the dotted line becomes finer as the infection probability decreases). Note that changing the infection probability shifts the curve but does not alter its shape. Panels b and c show model predictions for viruses with two (k = 2) and three (k = 3) genome segments at equal frequencies for different particle types, respectively, and the same infection probabilities. Note that while the genome segment number alters the shape of the curve, changing the infection probability only changes its shape. Panel d shows model predictions for a tripartite virus in which each segment has an infection probability of 3.3 × 10⁻³ but one segment has a 10-fold higher frequency than the other two. The shape of the dose-response curve is then similar to that of a bipartite virus. Panel e shows model predictions for a tripartite virus in which each segment has an infection probability of 3.3 × 10⁻³ but one segment has a 10-fold lower frequency than the other two. The dose response is then similar to that of a monopartite virus. In panel f, the frequencies of the different particle types are the same but the probability of infection for the rare segment is 3.3 × 10⁻². The dose-response curve is then as steep as possible for a tripartite virus in the absence of nonadditive interactions (k is equal to the actual number of genome segments or ω = 1), even though the particle frequencies are different.

