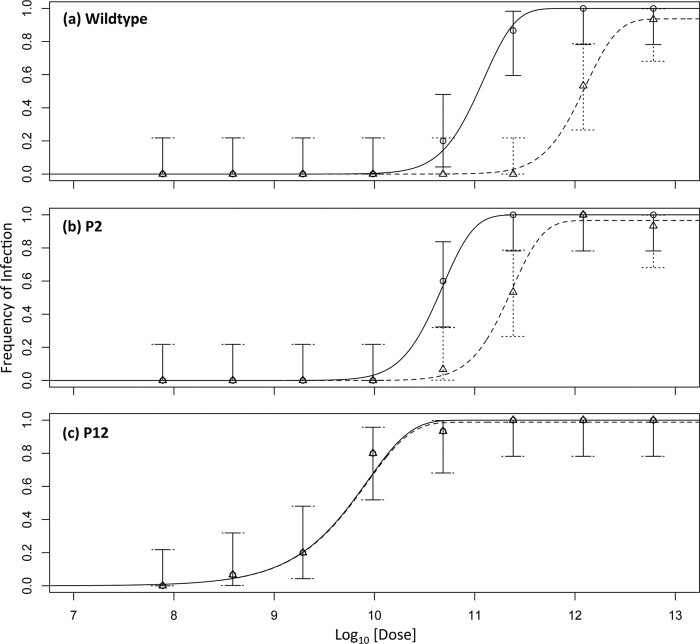
Fig 2.
Data and model predictions for different plant types. In all of the panels, the log10-transformed total dose of particles is on the abscissa and the frequency of infection is on the ordinate. The dose is the sum of the doses of all three particle types. Solid lines represent the predicted dose-response curves for infection of the inoculated host obtained by the best-supported model, i.e., DA for wild-type and P2 plants and IAH for P12 plants. The dotted lines represent the model prediction of the dose-response curves for systemic infection. Circles represent the data for infection of the inoculated leaf, and triangles represent the systemic infection data. Error bars indicate the 95% CIs. Note the steeper dose-response curves for wild-type and P2 plants and the decrease between the dose-response curves for the inoculated leaf and systemic tissue, from wild-type to P2 to P12 plants, at which point the two curves practically coincide. For parameter estimates, see Table 1.

