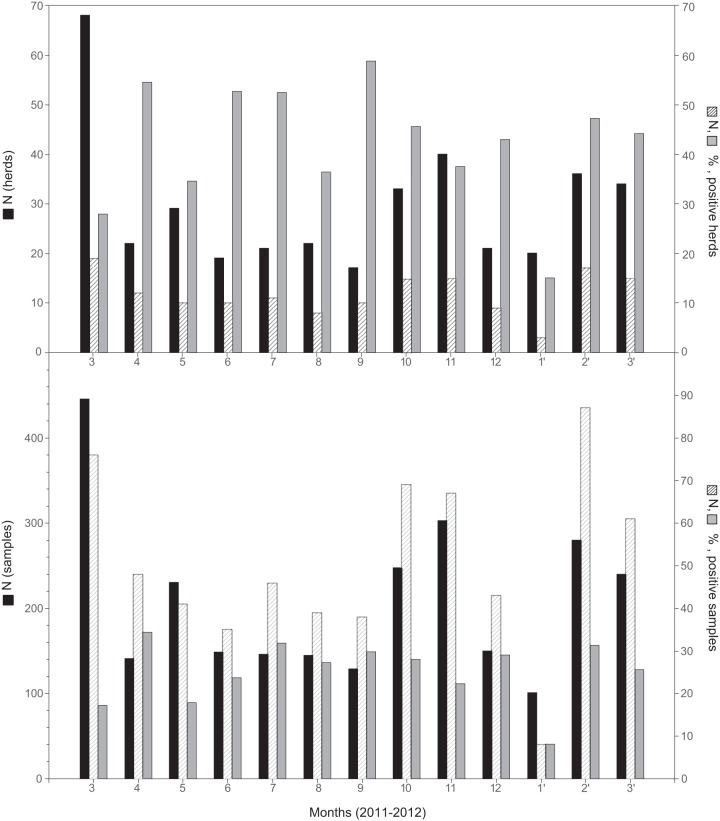
Fig 1.
Frequency of porcine influenza virus infection in selected swine herds (top) and individual animals (bottom) sampled in northwest Germany, March 2011 to March 2012. Filled bars, absolute numbers of herds/animals sampled (left y axis); hatched bars, absolute numbers of herds/animals that tested positive (right y axis); shaded bars, percentage of herds/animals that tested positive (right y axis).

