
Fig 5.
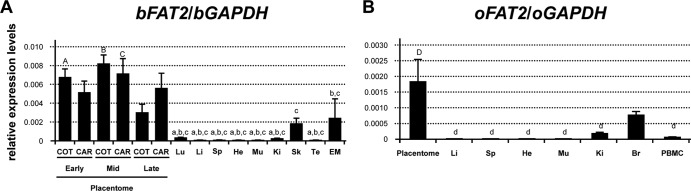
Expression of the FAT2 gene in the fetal placenta. (A and B) Quantitative real-time RT-PCR analysis of bFAT2 and oFAT2 mRNA levels in each indicated tissue. Values shown represent the means ± standard errors of bFAT2 and oFAT2 expression levels relative to that of GAPDH in each tissue. COT, ICOT, CAR, ICAR, Lu, Li, Sp, He, Mu, Ki, Sk, Te, EM, Br, and PBMC are abbreviations of cotyledon, intercotyledon, caruncular, intercaruncular, lung, liver, spleen, heart, muscle, kidney, skin, testis, endometrium, brain, and peripheral blood mononuclear cells, respectively. Assays were conducted in duplicate with 2, 3, or 6 individual samples (n = 4, 6, or 12). Results were statistically analyzed by means of one-way analysis of variance and Tukey-Kramer multiple-comparison tests. Differences were considered significant at a P value of <0.05 and are denoted by letters. These letters indicate statistical significances between A and a, B and b, C and c, and D and d, respectively.