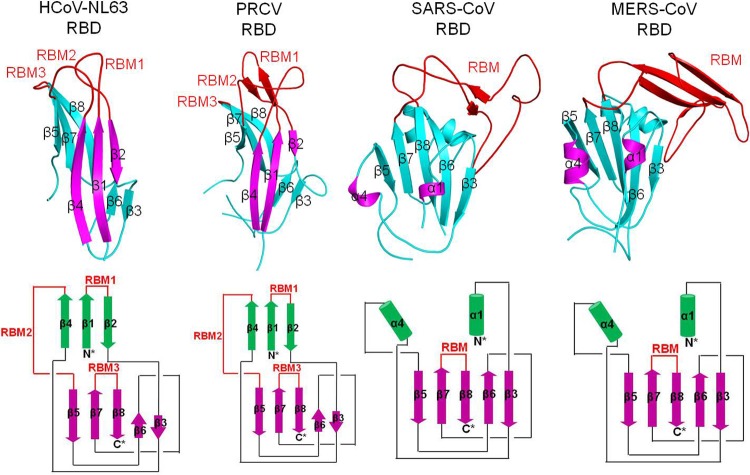
Fig 5.
Comparison of tertiary structures of coronavirus S1 C-domains. (Top) Tertiary structures of coronavirus C-domains (PDB IDs are the same as in Fig. 4). (Bottom) Schematic illustration of the structural topologies of coronavirus C-domains. β-strands are depicted as arrows and α-helices as cylinders. The secondary structures of all of the coronavirus C-domains are colored and numbered in the same way as for the HCoV-NL63 C-domain.

