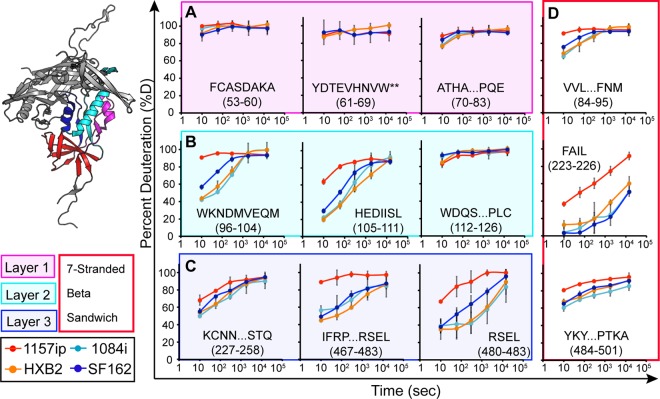
Fig 3.
Deuterium exchange profiles of homologous inner domain peptides. Each graph shows the deuterium uptake (percent deuteration) over time for peptides throughout the gp120 inner domain, which are either identical or homologous among the four gp120s. Each line in the graph reflects the deuterium uptake for that peptide in the context of a different isolate, as indicated in the figure legend. The peptide sequence and amino acid position (HXB2 numbering) are indicated for each graph. (A to C) Peptides from layers 1, 2, and 3 are color coded in the ribbon diagram, and deuteration uptake plots are grouped within the magenta, cyan, and blue boxes, respectively. (D) Peptides from the 7-stranded β-sandwich are bounded by a red box. A comparison of the deuterium uptake curves for a given peptide from multiple isolates revealed differences in stability, for example, the WKNDMVEQM peptide is more dynamic in 1157ip than in the other isolates. **, deuteration data obtained by subtraction of overlapping peptides. Error bars reflect standard deviations, calculated as described in Materials and Methods.

