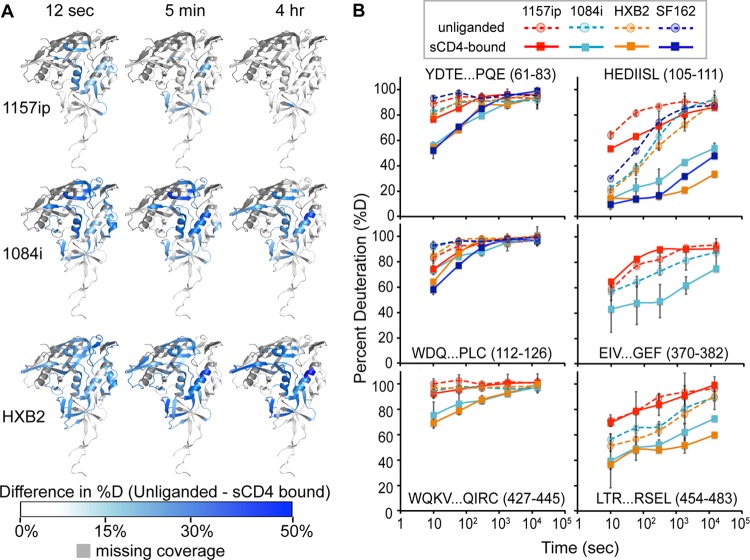
Fig 5.
Isolate-specific differences in sCD4-induced stabilization of gp120. (A) Difference heat maps show the spatial profile of sCD4-induced stabilization of gp120. The colors mapped onto the 3JWD structure indicate the quantitative differences in percent deuteration between unliganded and CD4-bound full-length gp120s. Darker blue areas correspond to greater CD4-induced stabilization. Missing peptide coverage is shown in gray. Difference heat maps for the 12-s, 5-min, and 4-h time points are shown. (B) Deuterium uptake plots (percent deuteration versus time) for identical or homologous peptides that are stabilized upon sCD4 binding. The peptide sequence and amino acid position (HXB2 numbering) are indicated for each peptide. The traces are color coded by isolates, as indicated in the symbol key. Stabilization as a result of sCD4 binding was observed as a downward shift in the deuterium uptake curve. Error bars reflect standard deviations, calculated as described in Materials and Methods.

