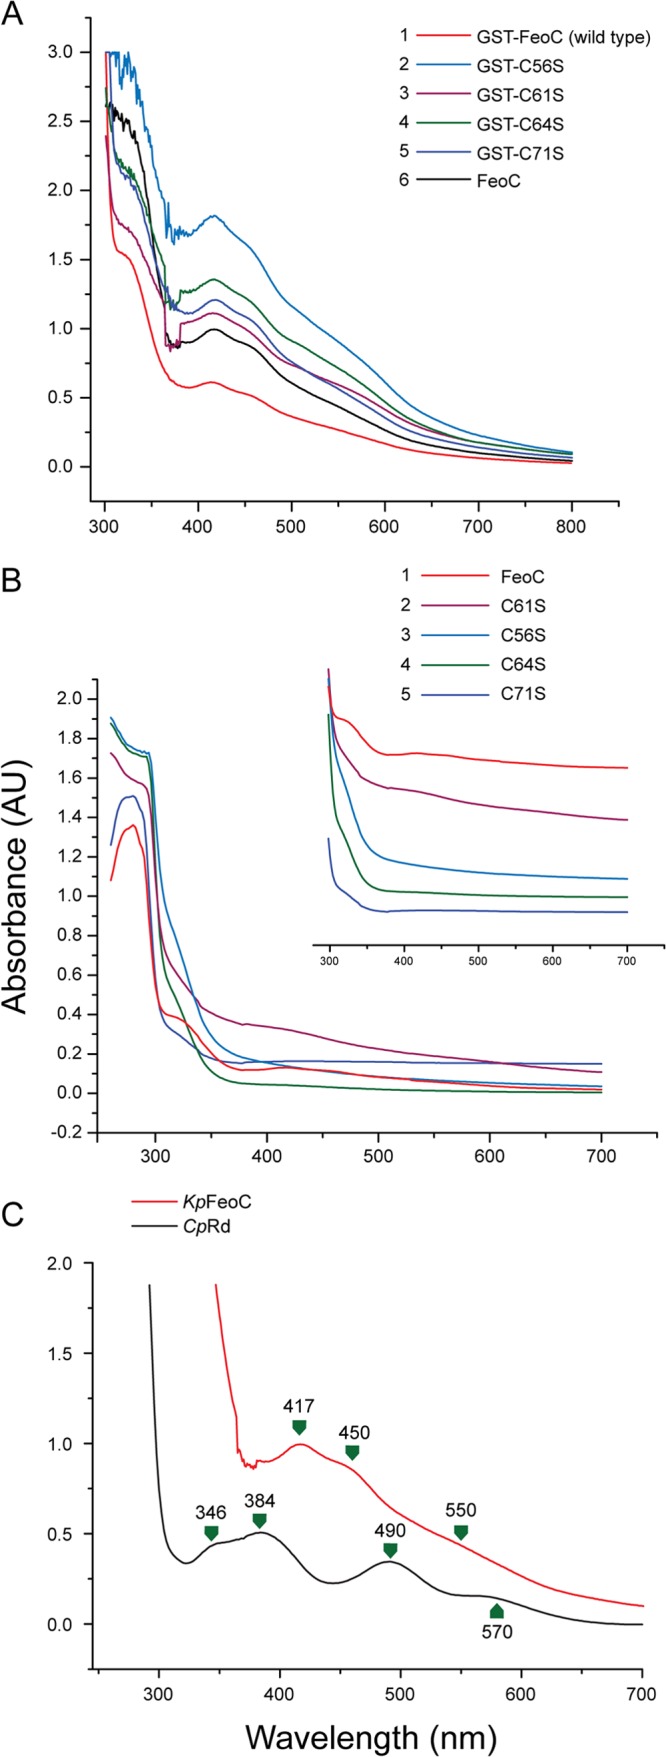
Fig 2.

The UV-Vis spectra of various freshly prepared KpFeoC samples (0.5 to 3 mM) in native state. (A) The UV-Vis spectra of GST-tagged KpFeoC (GST-KpFeoC) and four cysteine-to-serine single-site KpFeoC mutants at concentrations of 2.5, 1.5, 2.6, 2.6, and 0.9 mM for C56S, C61S, C64S, C71S, and wild-type GST-FeoC, respectively. (B) The UV-Vis spectra of GST-tag-free KpFeoC and its single-site mutants at concentrations of 0.5, 0.9, 0.8, 0.5, and 0.15 mM for C56S, C61S, C64S, C71S, and wild-type FeoC, respectively. The 300-nm to 700-nm region, which exhibits the characteristic absorption of iron-sulfur clusters, is shown in the inset, shifted in the y axis direction for clarity. (C) Comparison of the UV-Vis spectrum of 3 mM KpFeoC (red) and 1.5 mM CpRd (black), which possesses [1Fe].
