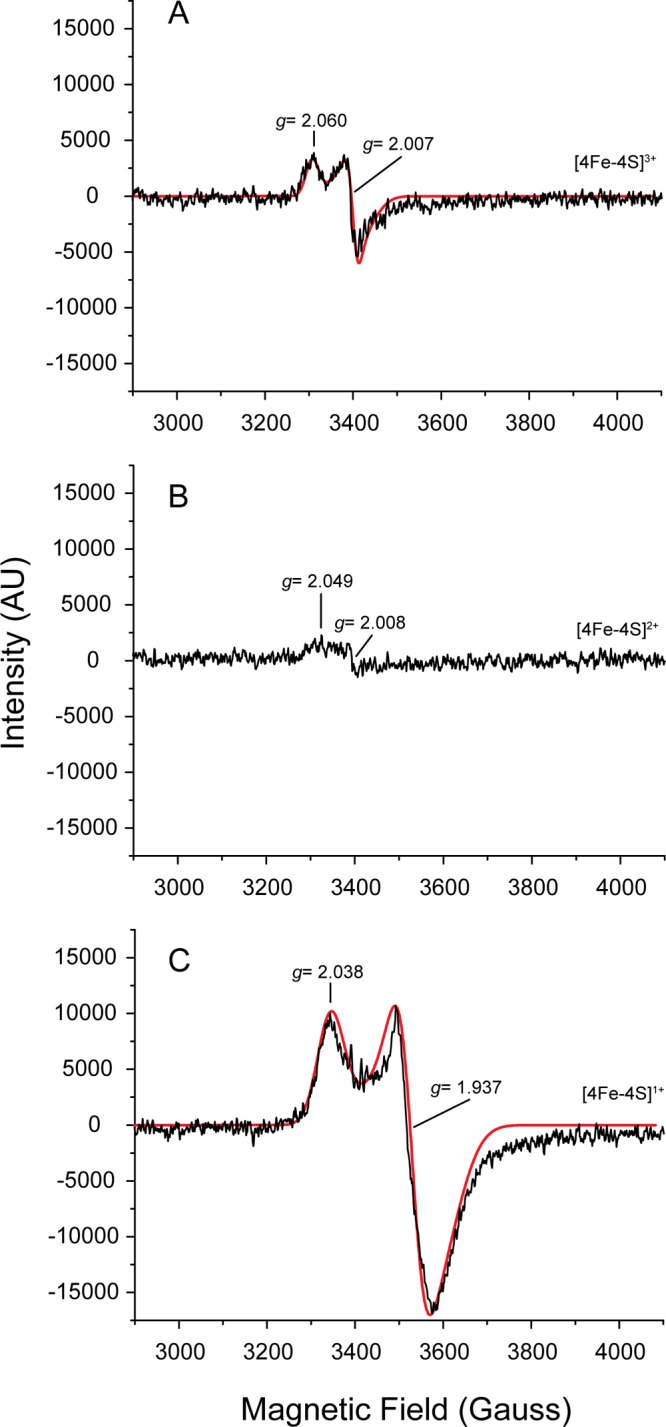
Fig 3.

EPR spectra (first derivatives) of KpFeoC at different redox states at 14 K. (A) Total of 2.1 mM KpFeoC at the native state; (B) 2.7 mM KpFeoC at the DTT-reduced state; (C) 2.7 mM KpFeoC fully reduced by sodium dithionite. A SimFonia simulated spectrum was overlaid (red solid line). The assigned redox states of the [4Fe-4S] clusters were labeled on the right. EPR properties are summarized in Table S1 in the supplemental material.
