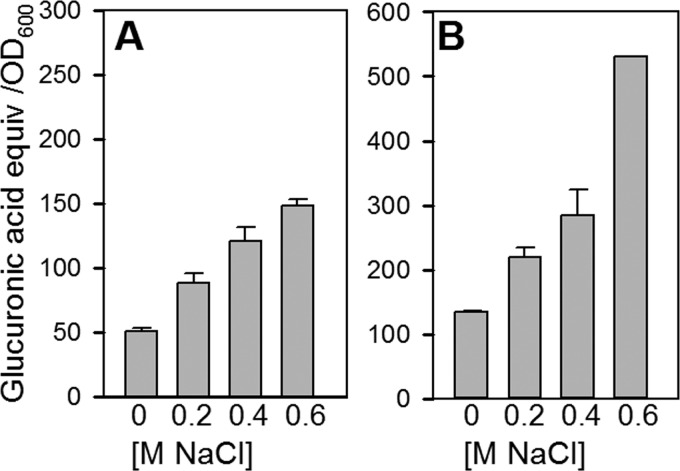
Fig 7.
Effect of osmolarity on the production of uronic acid-containing polysaccharides by B728a with cells grown in ½21CS (A) and MinAS (B) media. Media were amended with the molar concentrations of NaCl indicated on the x axis, and the ethanol-precipitated polysaccharides were quantified by the meta-hydroxydiphenyl assay and expressed as micrograms of glucuronic acid equivalent per OD600 unit. The polysaccharide from B728a resembled the uronic acid-containing polysaccharide alginate on the basis of its color and absorption spectrum, whereas the polysaccharide from DC3000 did not (see Fig. S7 in the supplemental material). The values are means ± standard errors (n = 5 [A] or 2 [B]); the error bars are present but not visible for all samples.

