Fig 2.

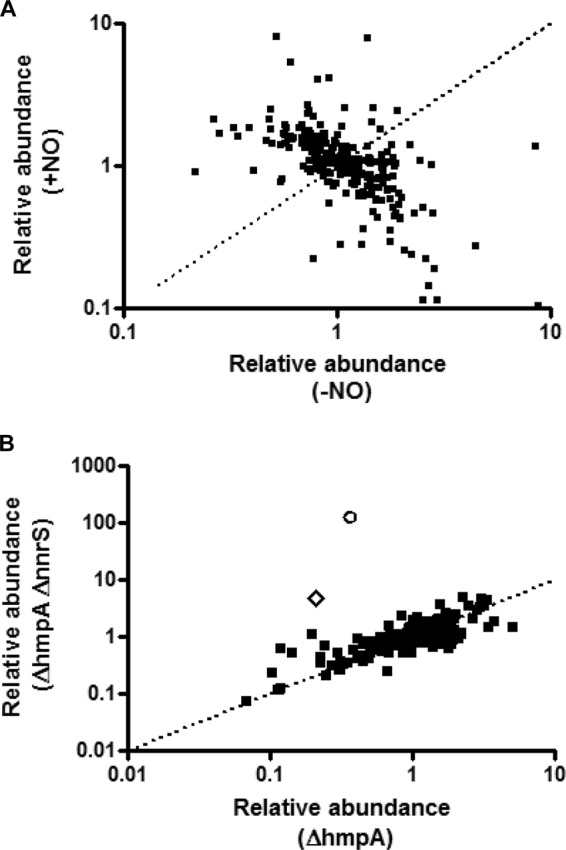
Scatter plots of metabolomic analyses of the effects of NO on V. cholerae. The relative concentrations of hundreds of metabolites were recorded for wild-type, ΔhmpA, and ΔhmpA ΔnnrS strains of V. cholerae. (A) Scatter plot of the relative abundances of metabolites in wild-type V. cholerae in the absence (x axis) and presence (y axis) of the NO donor DETA-NONOate. The area above the dotted line indicates relative accumulation in the presence of NO; the area below the dotted line indicates relative accumulation in the absence of NO. (B) Scatter plot of the relative abundances of metabolites in the presence of NO for the ΔhmpA strain (x axis) compared to the ΔhmpA ΔnnrS strain (y axis). The area above the dotted line indicates accumulation in the ΔhmpA ΔnnrS strain; the area below the dotted line indicates accumulation in the ΔhmpA strain. Circle, citrate; diamond, cis-aconitate.
