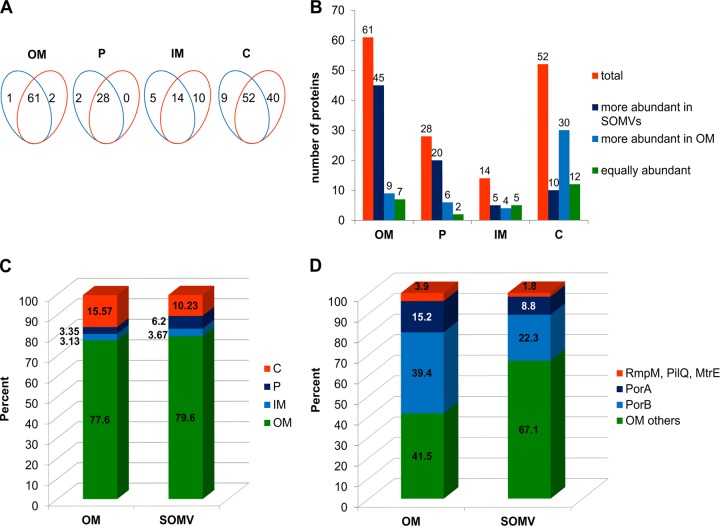
Fig 3.
Comparative proteome analysis of SOMV and OM with a metabolic standard. OM and from SOMV proteins were quantified against a metabolic standard. (A) Venn diagrams showing the numbers of proteins from either SOMVs (blue) or the OM (orange) that could be quantified against the metabolic standard. The proteins were sorted according to predicted subcellular localization. P, periplasm; C, cytosol. (B) Distribution of quantified proteins according to enrichment or depletion in SOMVs. (C) Relative amounts of proteins with distinct subcellular localizations. The sum of the NSAFs was calculated for each subcellular localization. (D) Proportions of all OM proteins that are major OM proteins (PorA, PorB) and minor OM proteins (RmpM, PilQ, MtrE) according to NSAFs. SOMVs were depleted of PorA, PorB, and RmpM plus PilQ plus MtrE in favor of the other 56 OM proteins.

