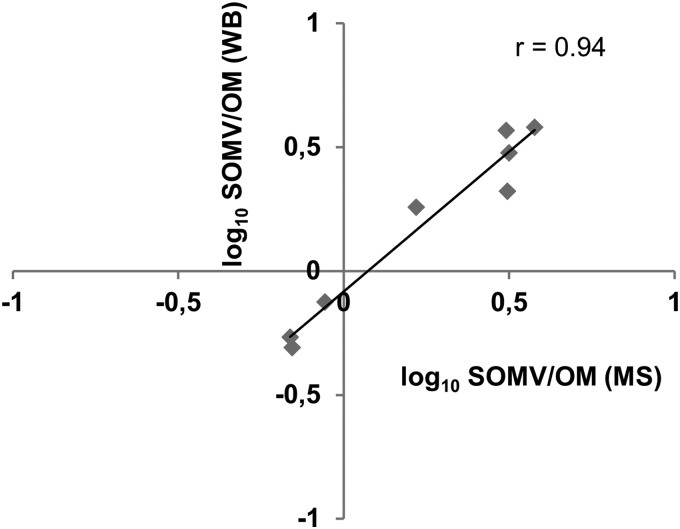
Fig 4.
Verification of proteomic data by Western blotting and ELISA. PorA, PorB, ZnuD, Opc, fHbp, NMB0801, and NMB1475 from SOMVs and the OM were detected with specific antibodies. The relative abundance of a certain protein in both fractions was calculated from the respective band intensities. SOMV/OM protein abundances obtained by MS (x axis) and Western blotting (WB, y axis) are shown. The Pearson correlation coefficient (r) was 0.94. For NspA, the SOMV/OM value was calculated from ELISA.

