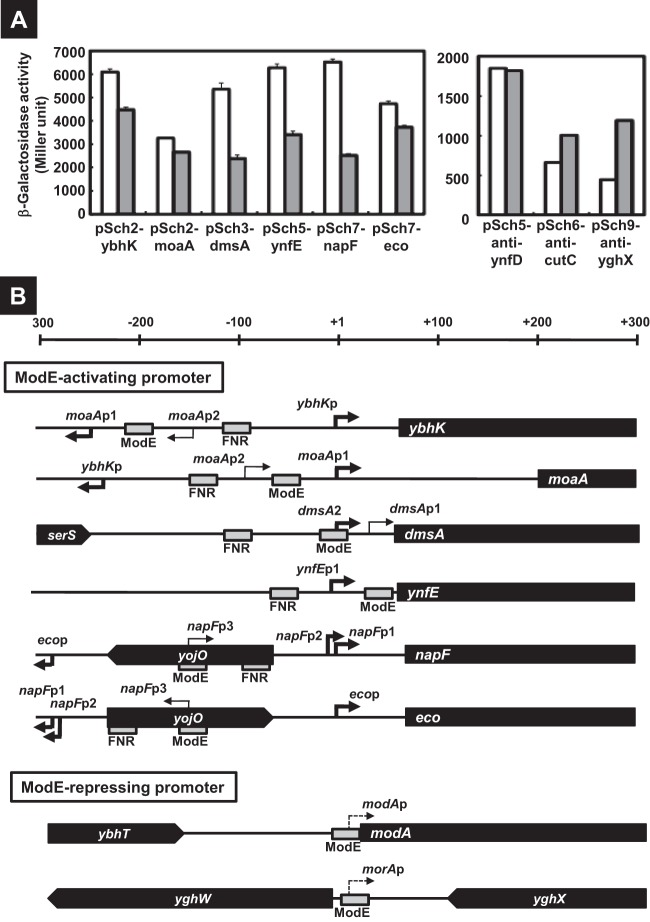
Fig 2.
Promoters activated and repressed by ModE. (A) The lacZ reporter plasmids (see Table S2 in the supplemental material) were introduced into the BW25113 (white bars) and the modE-deficient JW0744 (gray bars), and then the transformants were subjected to β-galactosidase assay. The β-galactosidase activity was represented as a Miller unit in the graph. (B) Organization of the promoters controlled by ModE is shown. The locations of ModE- and FNR-binding sites (gray box) at relative positions to the transcription initiation site (bold and dot arrows represent ModE-activating and repressing sites, respectively) are shown for the promoters. The filled bars represent open reading frames of the target genes.

