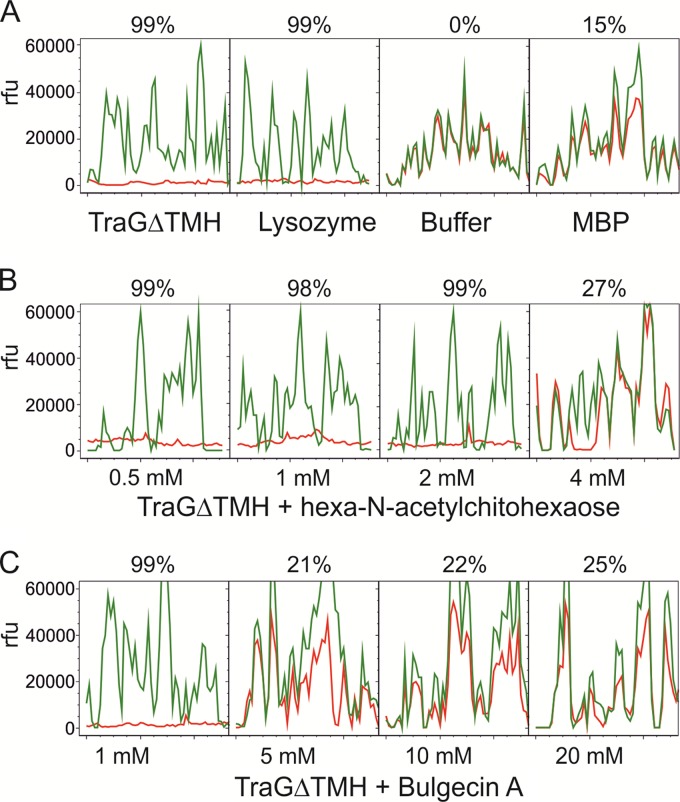
Fig 4.
Cy3 PG degradation by TraGΔTMH. Cy3-labeled PG was measured before (green lines) and after (red lines) digestion. Line scans are shown for a window of 50 pixels (2 mm). rfu, relative fluorescence units. Values above each box indicate the reduction of the fluorescence in each Cy3 PG spot and therefore reflect enzymatic activity (for details, see Materials and Methods). (A) Cy3 PG was digested with the indicated proteins or incubated with buffer alone. (B and C) Inhibition of TraGΔTMH with indicated concentrations of hexa-N-acetylchitohexaose and bulgecin A, respectively.

