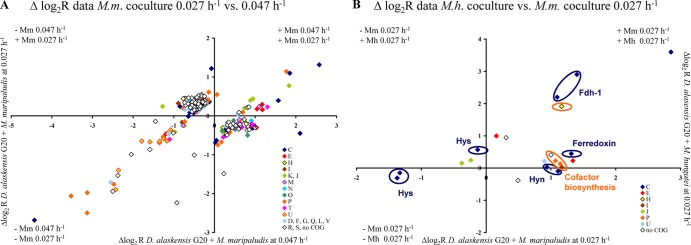
Fig 5.

(A) Plot of the log2 R values of the 268 genes of D. alaskensis G20 differentially expressed during syntrophic growth with M. maripaludis between different growth rates. (B) Plot of the log2 R values of the 22 genes of D. alaskensis G20 differentially expressed during syntrophic growth between different methanogens at the same growth rate. Genes are differently colored according to their COG functional category affiliation (single-letter code: amino acid transport, E; carbohydrate transport and metabolism, G; cell division and chromosome partitioning, D; cell motility and secretion, N; cell envelope biogenesis, M; chromatin structure and dynamics, B; coenzyme metabolism, H; defense mechanism, V; energy production and conservation, C; function unknown, S; general function prediction only, R; inorganic ion transport and metabolism, P; intracellular trafficking and secretion, U; lipid metabolism, I; nucleotide transport and metabolism, F; posttranslational modification, protein turnover, chaperones, O; DNA replication, recombination and repair, L; secondary metabolites biosynthesis, transport and catabolism, Q; signal transduction mechanisms, T; transcription, K; and translation, ribosomal structures and biogenesis, J).
