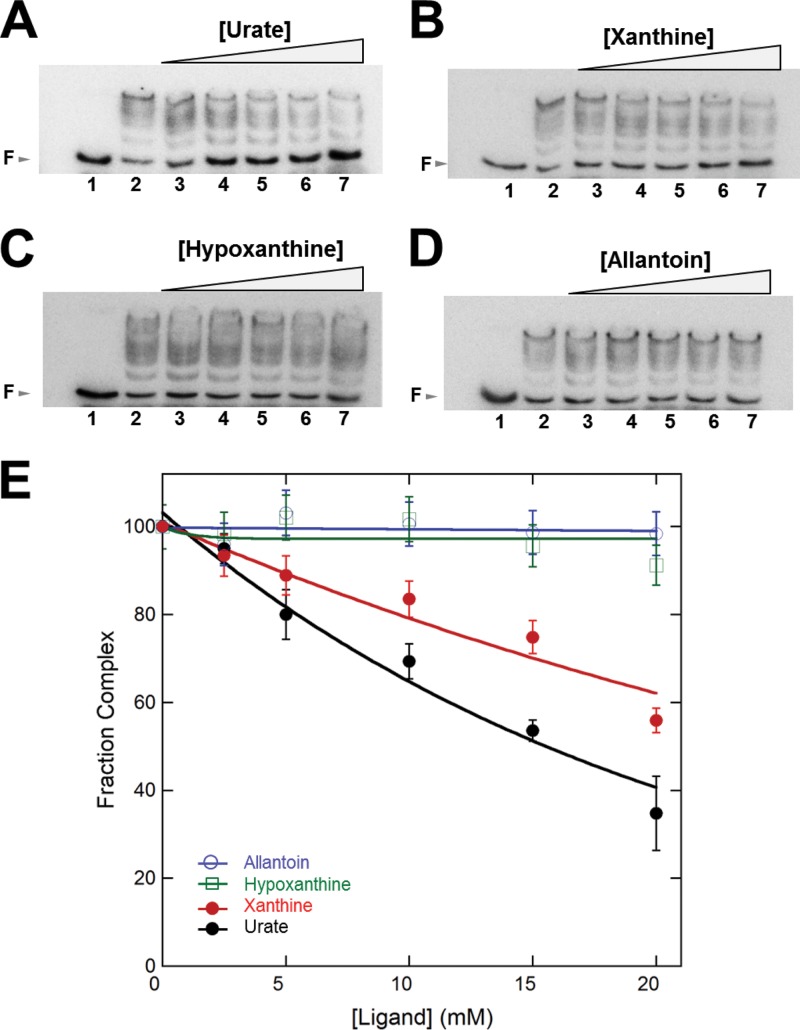
Fig 7.
Effect of different ligands on the binding of PecS to pecO. Free DNA (F) is identified by arrows at the left. (A to D) Reactions in lane 1 contained labeled pecO DNA only. Ligand concentrations in lanes 2 to 7 were 0, 2.5, 5, 10, 15, 20 mM, respectively. Each reaction mixture contained 0.10 nM DNA and 1.25 nM PecS (lanes 2 to 7). Note that reaction mixtures contained 0.5 M Tris to prevent changes in pH upon the addition of ligands dissolved in sodium hydroxide; the difference in buffer composition also resulted in a different pattern of complex migration (less distinct separation of complexes) compared to that of reaction mixtures in Fig. 5A. (E) Normalized PecS-pecO complex formation as a function of ligand concentration. Error bars represent the standard deviations from three independent repeats.

