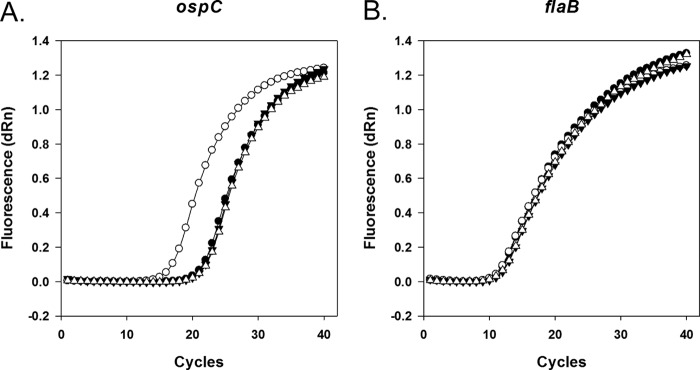
Fig 1.

Actinomycin D prevents induction of transcription of ospC controlled by an IPTG-inducible promoter. Quantitative RT-PCR amplification curves are shown for ospC (A) and flaB (B) transcripts. A3-LS-flacp-ospC cultures at mid-log growth phase were split, and half of the initial culture was treated with actinomycin D (final concentration, 150 μg ml−1). Thirty minutes later, cultures were split again and treated with IPTG or used as controls lacking an inducer. Cells were cultured for an additional 3 h before RNA isolation and qRT-PCR amplification. ●, Lacking both actinomycin D and IPTG (CT ospC = 22.22; CT flaB = 12.42); ○, lacking actinomycin D but containing IPTG (CT ospC = 17.51; CT flaB = 12.30); ▼, containing actinomycin D but lacking IPTG (CT ospC = 22.57; CT flaB = 12.96); Δ, containing both actinomycin D and IPTG (CT ospC = 22.70; CT flaB = 12.87). Ten ng of total RNA was used in each reaction mixture. dRn, magnitude of the fluorescence signal over background fluorescence generated at each time point.
