Figure 2.

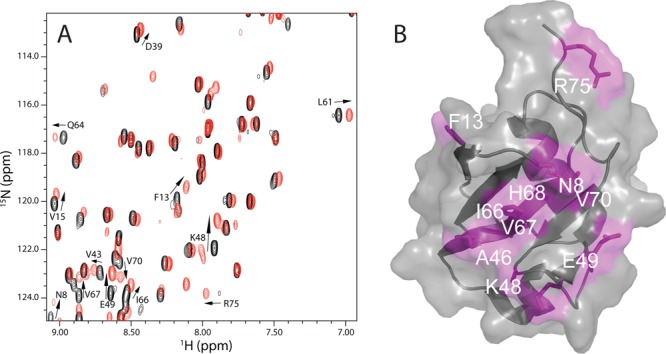
Ataxin-3 UIM regions interact with the parkin Ubl domain. (A) Region of 1H–15N HSQC spectra of the 15N-labeled Ubl domain (105 μM) in the absence (black) and presence (red) of excess ataxin-3 UIM_123 protein. Resonances that experienced the largest chemical shift changes upon UIM_123 addition are labeled, and the direction of the chemical shift change is denoted with an arrow. (B) Surface representation of the parkin Ubl domain (Protein Data Bank entry 1IYF) showing the binding surface for UIM_123. Residues that displayed chemical shift changes >0.5 standard deviation above the mean (0.078 ppm) are colored pink and labeled. The surface representation was created in PyMOL (PyMOL Molecular Graphics System, version 1.5.0.4, Schrödinger, LLC).
