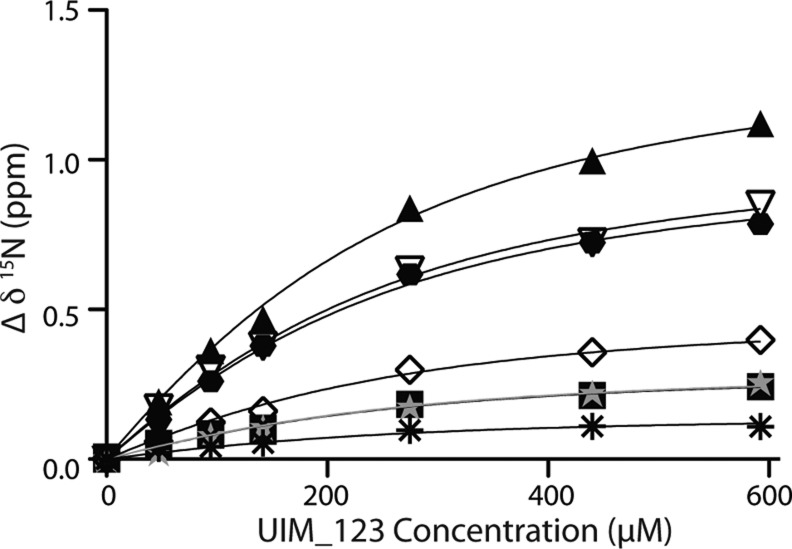
Figure 6.
Multivalent ligand binding curves for the ataxin-3 UIM region binding to the parkin Ubl domain. Binding curves were generated by measuring the change in the 15N chemical shift from the data collected in Figure 5A. A KD of 669 ± 62 μM was determined using eq 6 and a global fit from changes in the chemical shift of K48 (▲), A46 (▽), E49 (⬣), V15 (◇), I44 (■), L50 (gray stars), and V43 (∗).

