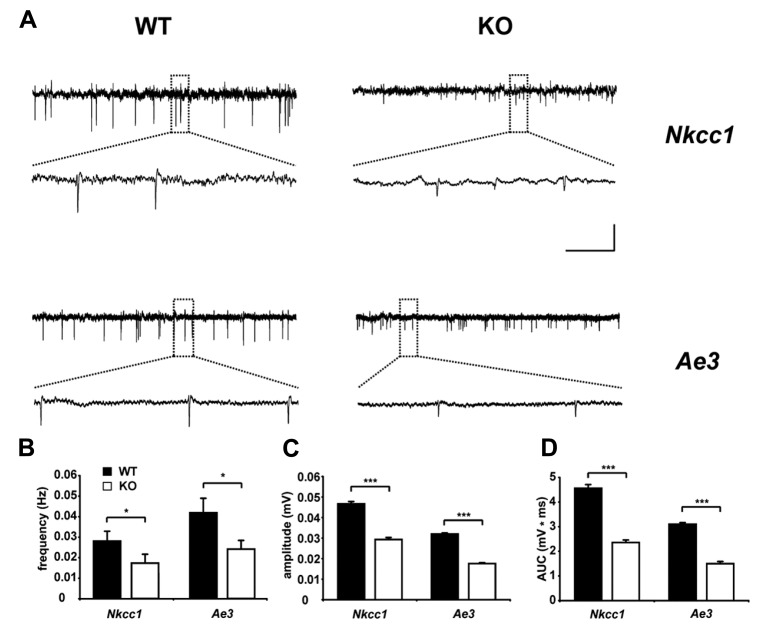
FIGURE 3.
Reduced spontaneous electrical activity in hippocampal slices of NKCC1 and AE3 knockout mice. (A) Representative extracellular recordings from the stratum pyramidale (CA3) of postnatal day 5 NKCC1 and AE3 WT and KO slices. The framed parts are shown as enlargements below the original trace. Calibration: horizontal, 2 min (original trace), 7.5 s (enlargement); vertical, 0.04 mV. Quantification of frequency (B), amplitude (C), area under curve (AUC), and (D) of single spontaneous electrical events. The asterisks indicate significant difference (*p < 0.05, ***p < 0.001, t-test). Error bars indicate SEM. Reprinted from Pfeffer et al. (2009).

