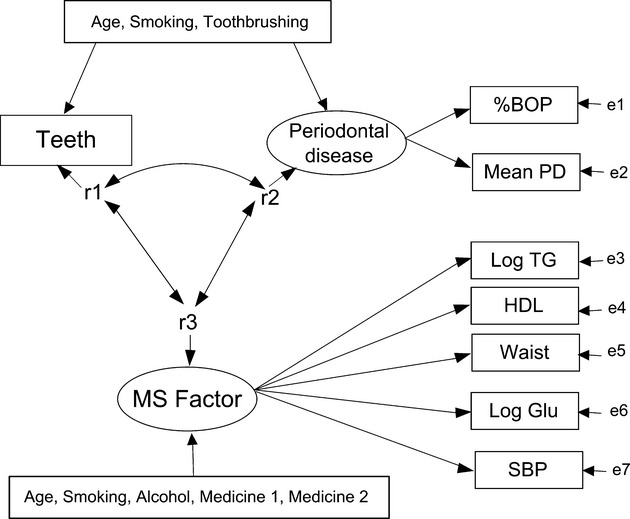
Fig 1.

The metabolic syndrome (MS) single-factor model (Model 1). Rectangles indicate observed variables and ovals show latent constructs. Single-headed arrows indicate the directions of causal effects relating to the variables concerned, and the double-headed arrows imply the associations among the variables. The fit of Model 1 was χ2 (42) = 362.198; CFI = 0.807; RMSEA = 0.086 (0.078–0.094); SRMR = 0.055 in males and χ2 (42) = 358.831; CFI = 0.865; RMSEA = 0.075 (0.068–0.083); SRMR = 0.045 in females. The e1–e7 and r1–r3 designators refer to error terms and residual terms.
