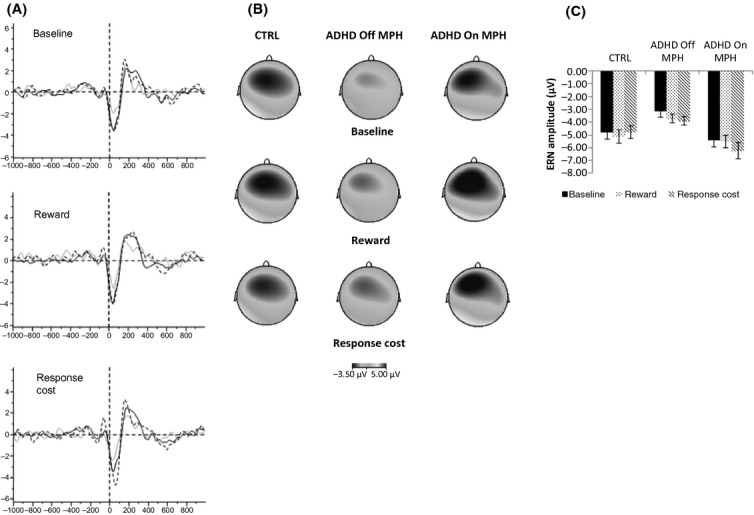
Figure 2.

(A) ERP waveforms at FCz for each motivational condition in the CTRL group (solid black line), ADHD Off MPH (solid grey line) and ADHD On MPH (dashed line). Each plot shows amplitude in microvolts on the y axis and time in milliseconds on the x-axis. (B) Topographic plots showing the distribution of amplitudes on the scalp in microvolts at peak ERN amplitude for each group/day and motivational condition. (C) Mean amplitude in each motivational condition for the CTRL group, ADHD Off MPH and On MPH. The CTRL group data are collapsed across both days in all plots
