Fig 3.

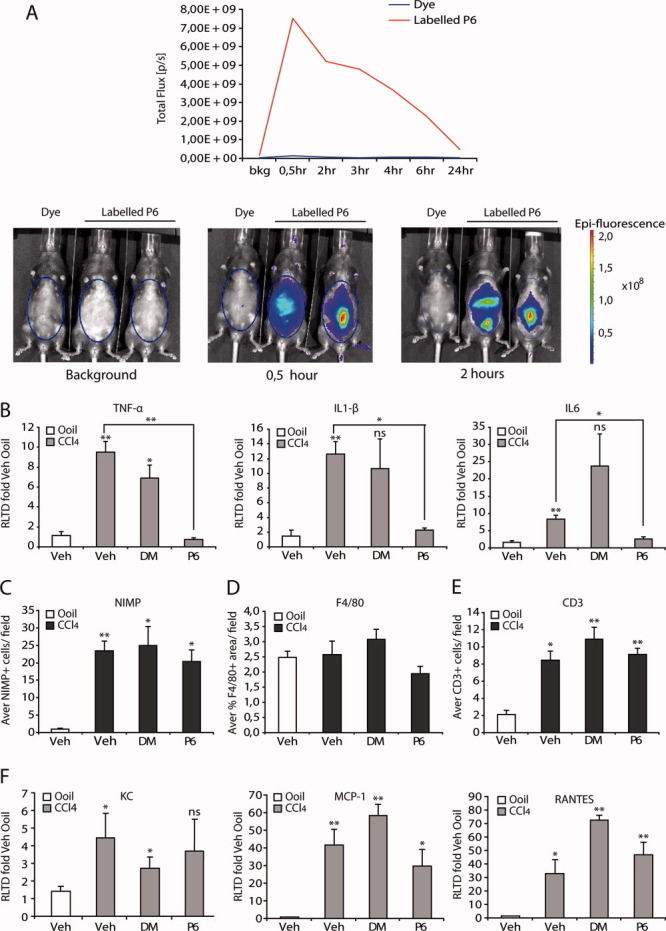
P6 does not suppress inflammation in acute CCl4 injury. IVIS tracking of DyLight 800 fluorescent-labeled P6 up to 24 hours IP injection. Graph shows total flux [p/s] taken from the regions of interest at 0.5, 2, 3, 4, 6, and 24 hours; n = 2 mice. Free dye was used as a control. Representative images of background 30 minutes and 2 hours after immunoprecipitation. Blue ovals denote the regions of interest used to calculate total flux. (A) Hepatic TNF-α, IL-1β, and IL-6 mRNA expression (B). Quantification of neutrophils (NIMP), (C) macrophages (F4/80) (D), and hepatic T cells (CD3) (E). Whole-liver mRNA expression of KC, MCP-1, and RANTES (F). Significance is compared to vehicle, unless shown on graph. Data are expressed as mean ± standard error of the mean and are representative of 5 animals per group.
