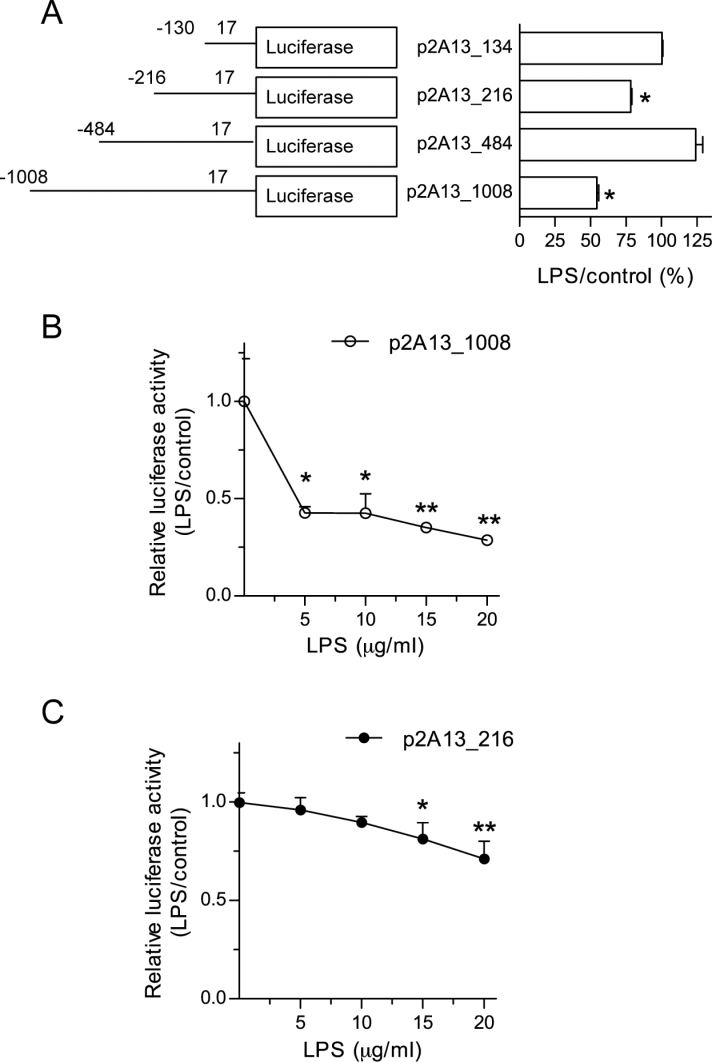
Fig. 3.
Identification of LPS response regions within CYP2A13 promoter. (A) Effects of LPS on CYP2A13 promoter activity in NCI-H441 cells. NCI-H441 cells were transiently transfected with one of four CYP2A13 promoter constructs, at 24h prior to LPS treatment of the cells (at 10 μg/ml), and luciferase activities were determined 24h after the LPS treatment. Activities of firefly luciferase in cell lysates were normalized to those of cotransfected Renilla reniformis luciferase, and the results are shown as relative activities (LPS treated/untreated × 100) for each promoter construct. The amounts of CYP2A13 promoter sequence included in each construct are indicated. Data (means ± SD) represent three independent experiments. *p < 0.05, indicating significant decreases in promoter activity in LPS-treated relative to untreated cells (Student’s t-test). (B and C) Dose-response of the effects of LPS on CYP2A13 promoter activity. NCI-H441 cells were transfected with p2A13_1008 (B) or p2A13_216 (C) at 24h prior to LPS treatment at various doses, and luciferase activities were determined 24h after the LPS treatment. Data represent means ± SD (n = 3). *p < 0.05; **p < 0.01, one-way ANOVA followed by Dunnett’s multiple comparison test, compared with corresponding untreated cells.

