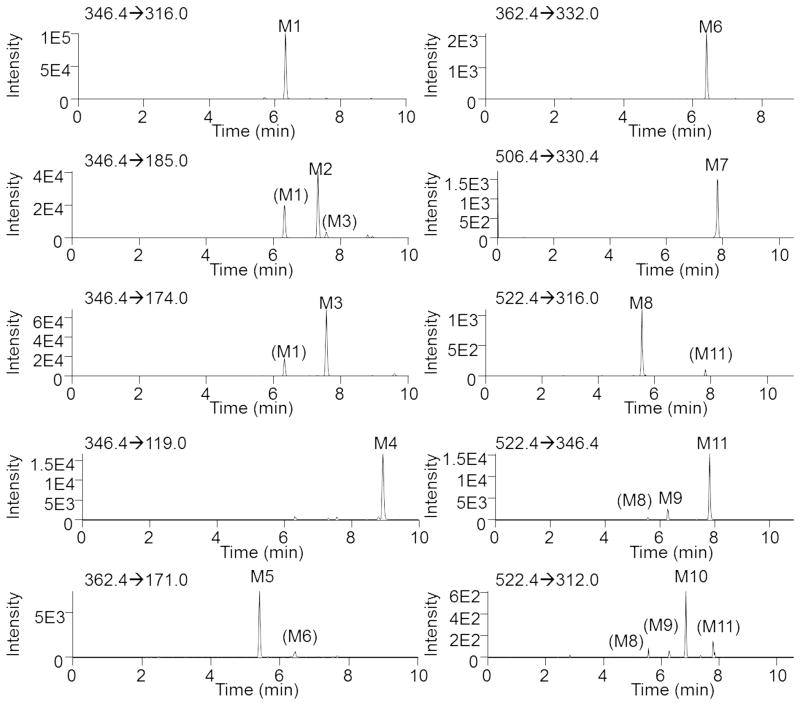
Fig. 3.
Extracted ion chromatograms showing the transitions used to monitor dapivirine metabolite formation. Dapivirine (10 μM) was incubated with human liver microsomes (1 mg/mL) for 30 min at 37 °C in the presence of a NADPH-regenerating system. Fragmentation spectra were used to derive the following transitions (Q1→Q3): M1 (m/z 346.4→316.0); M2 (m/z 346.4→185.0); M3 (m/z 346.4→174.0); M4 (m/z 346.4→119.0); M5 (m/z 362.4→171.0); M6 (m/z 362.4→332.0); M7 (m/z 506.4→330.4); M8 (m/z 522.4→316.0); M9 (m/z 522.4→346.4); M10 (m/z 522.4→312.0); and M11 (m/z 522.4→346.6).

