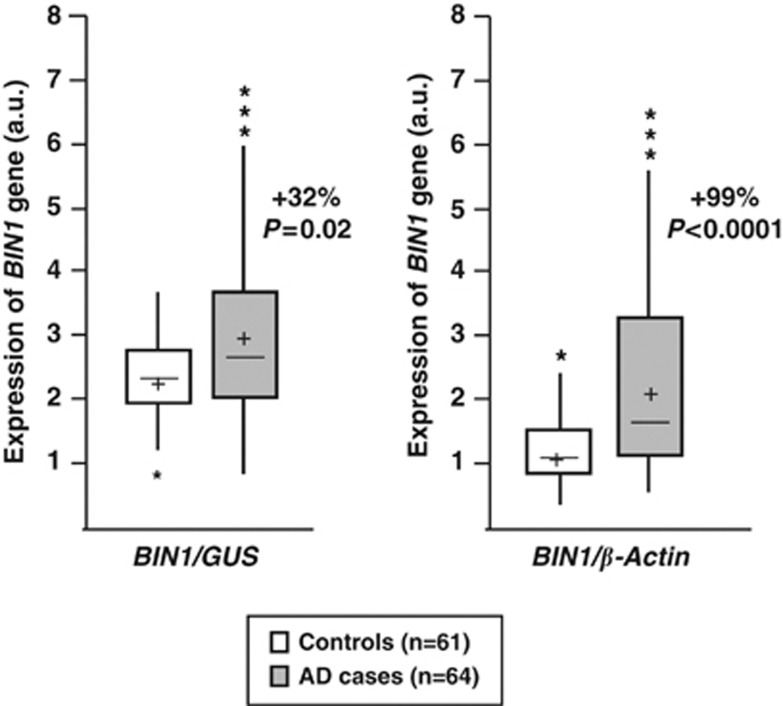
Figure 1.
BIN1 mRNA levels in AD and control brains. All values of BIN1 mRNA are shown as arbitrary units (a.u.) following normalisation by GUS (β-glucuronidase) or β-actin mRNA quantification. mRNA quantifications were carried out in triplicate in all individuals. cross: mean of BIN1 expression in cases and controls; middle line: median; upper horizontal line: inclusion of 75% of the individuals; lower horizontal line: inclusion of 25% of the individuals. *Individuals exhibiting extreme values (out of the global distribution).

