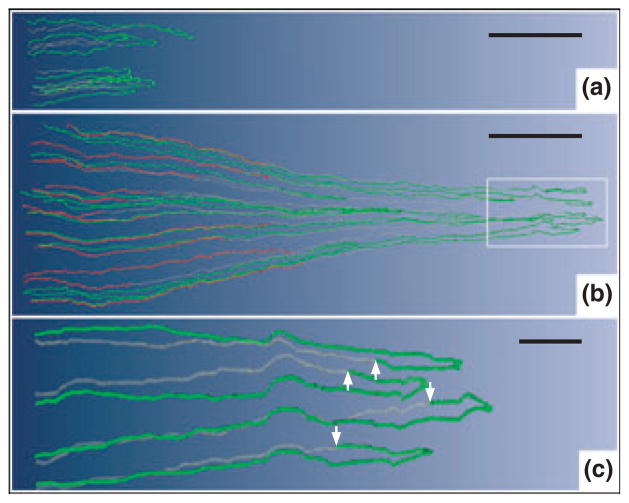
Figure 1.
Computer-assisted reconstruction of loops of Henle from rat inner medulla (IM) showing expression of aquaporin-1 (AQP1; red) and chloride channel (ClC-K1; green); grey regions (αB-crystallin) express undetectable levels of AQP1 and ClC-K1. Loops are oriented along the corticomedullary axis, with the left edge of each image nearer the base of the IM. (a) Thin limbs that have their bends within the first millimetre beyond the OM–IM boundary. Descending segments lack detectable AQP1. ClC-K1 is expressed continuously along the prebend segment and the ATL. (b) Loops that have their bends beyond the first millimetre of the IM. AQP1 is expressed along the initial 40% of each descending thin limb (DTL) and is absent from the remainder of each loop. ClC-K1 is expressed continuously along the prebend segment and the ATL. Boxed area is enlarged in c. (c) Enlargement of near-bend regions of four thin limbs from box in b. ClC-K1 expression, corresponding to DTL prebend segment, begins, on average, 165 μm before the loop bend (arrows). Scale bars: 500 μm (a and b); 100 μm (c). From Layton et al. (2004), used with permission.

