
Figure 17.
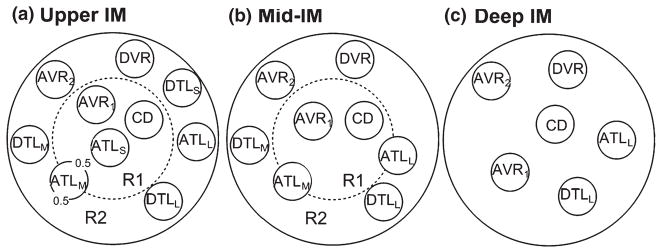
Schematic diagram of a cross section through the upper inner medulla (IM) (outer zone 1; a), mid-IM (outer zone 2; b) and deep IM (inner zone; c) showing concentric regions and relative positions of tubules and vessels. Decimal numbers in (a) indicate relative interaction weightings with regions. R1 represents intracluster region; R2 represents intercluster region. DTLS and ATLS are descending and ascending thin limbs of long loop of Henle that turns within the first 1.0 mm (outer zone 1) of the IM; DTLM and ATLM are descending and ascending thin limbs of long loop of Henle that turns within the mid-IM (outer zone 2); DTLL and ATLL are descending and ascending thin limbs of long loop of Henle that reaches into the deep IM (inner zone). CD, collecting duct; DVR, descending vas rectum; AVR1, ascending vas rectum within intracluster region; AVR2, ascending vas rectum within intercluster region. From Layton et al. (2010), used with permission.