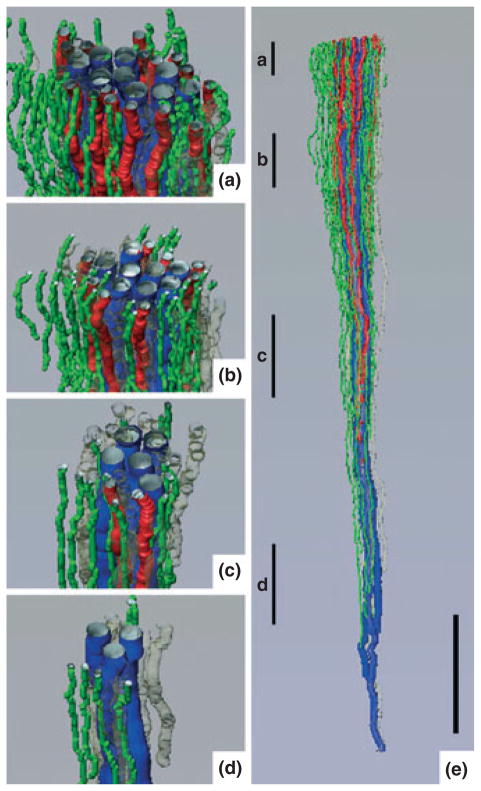
Figure 6.
Three-dimensional reconstruction showing spatial relationships of descending vasa recta (DVR; green tubules) and descending thin limbs (DTLs; red tubules) to collecting ducts (CDs; blue tubules) for a single CD cluster. DTL segments that do not express aquaporin-1 were identified by their expression of αB-crystallin and are shown in grey. DVR and DTLs are spatially separate from the CDs and panels (a)–(d) show that this relationship continues along the entire axial length of the CD cluster. Tubules in panels (a)–(d) have been rotated forwards approx. 2°. Axial positions of panels (a)–(d) are shown in panel (e) with lower case letters. Tubules are oriented in a corticopapillary direction, with the upper edge of the image near the base of the IM. Scale bar, 500 μm. From Pannabecker and Dantzler (2006), used with permission.

