
Figure 3. Temporal dynamics of (A) viral loads and (B) CD4 counts in the seven superinfected (SI) patients.
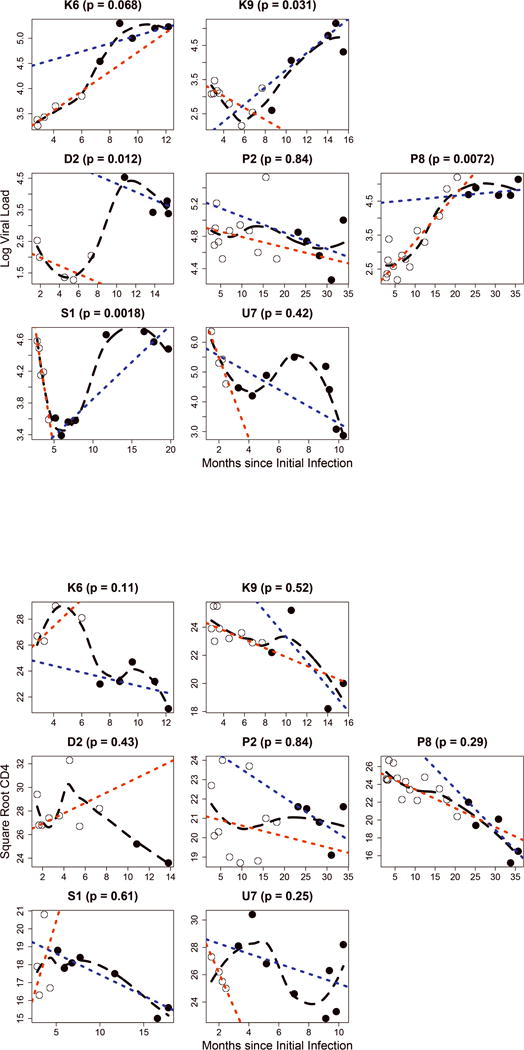
Legend: p – significance level for a structural shift in dynamics following SI (Chow’s test); open circles – samples preceding SI; filled circles – samples following SI; black dashed line – loess fit; red dotted line – linear fit to pre-SI points; blue dotted line – linear fit to post-SI points. EDI: estimated date of infection.