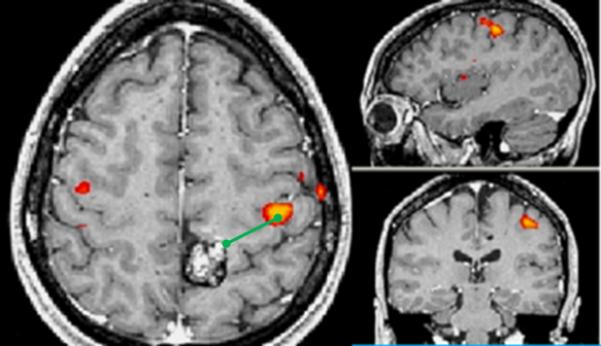
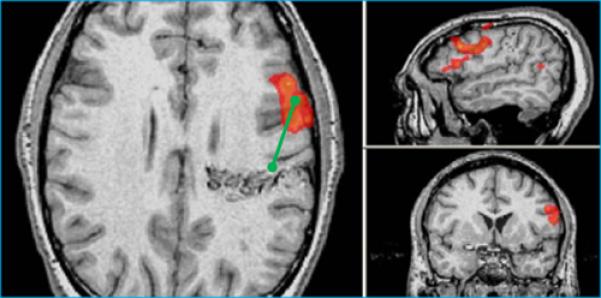
Figure 1.


Typical measurements. In each panel, the images are axial (left), sagittal (top), and coronal (bottom), images are shown following radiological convention, with left on right. A. Patient showing left sensorimotor activation (red-orange colors) in close proximity to a posterior left frontal cavernoma. B. Patient with left frontal AVM showing Broca's activation during antonym word generation task. LAD distances (green lines) are shown from lesion edge to activation centroid as measured in PACS(Picture Archiving and Communication System).
