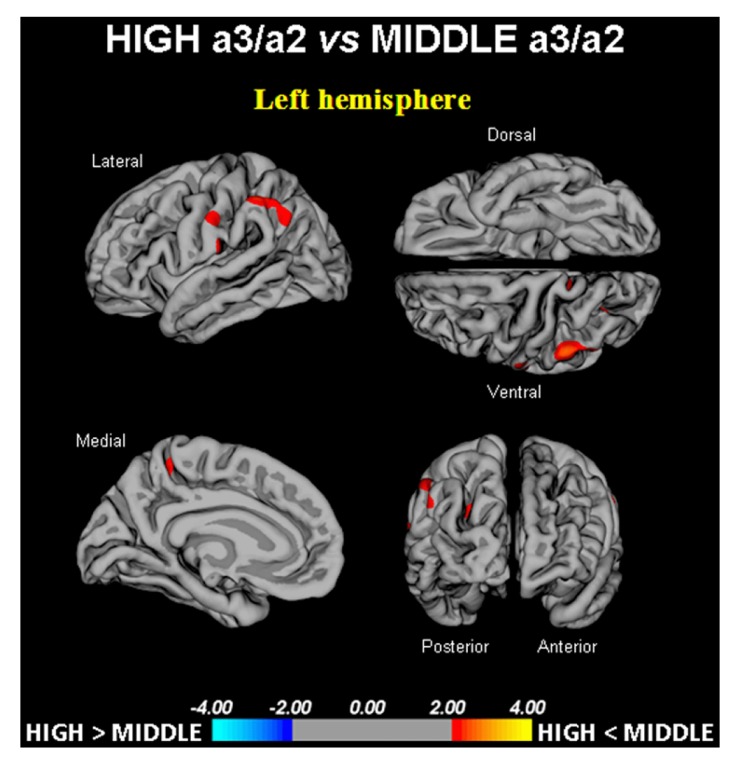
FIGURE 2.
In red are represented the brain regions with higher regional cortical thickness in MCI with high a3/a2 ratio as compared to MCI with middle a3/a2 ratio (p < 0.01 uncorrected). The color-coding for p values is on a logarithmic scale. Results are presented on the pial cortical surface of brain: dark gray regions represent sulci and light gray regions represent gyri.

