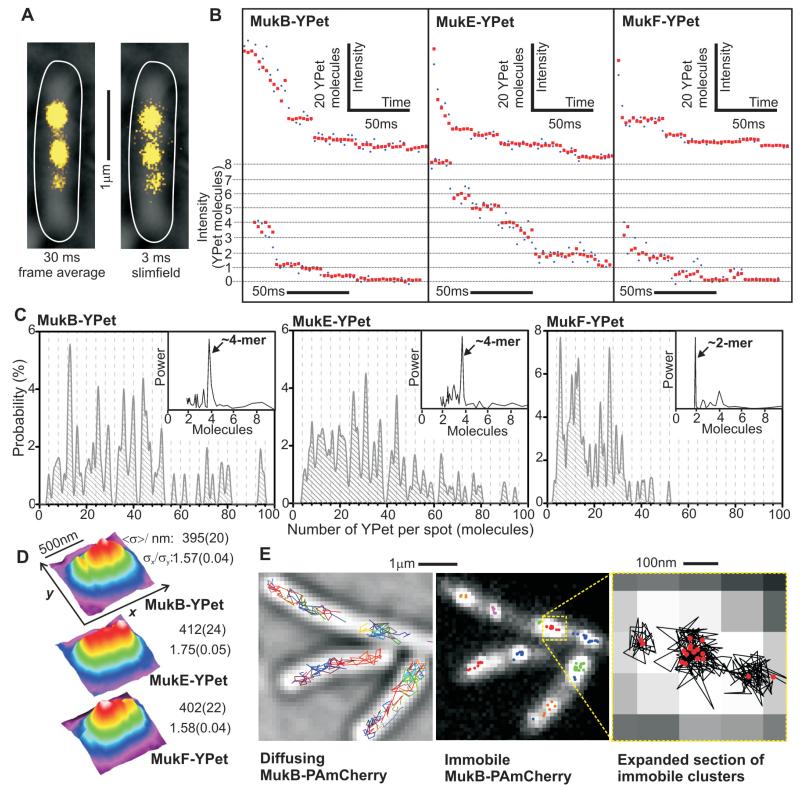
Fig. 1.
MukBEF imaging. (A) Representative frame-average and slimfield MukB-YPet cell images (yellow), brightfield and cell outline overlaid (white). (B) Photobleaching of MukBEF-YPet spots, high (upper row) and low stoichiometry data (expanded sections, lower row), raw (blue) and filtered (red). (C) Stoichiometry distributions, N=51-84 cells. 4-mer interval grid-lines, power spectra (arbitrary units) inset. (D) False-color plots for mean 2D spatial distributions for slimfield images with a 3 ms integration time, N=197-237 spots. Estimates for FWHM <σ> and σx/σy for Gaussian fits parallel to x and y axes (s.d. error). (E) Live-cell PALM, diffusing (gray brightfield, tracks colored) and immobile MukB-PAmCherry (different clusters colored), expanded indicating tracks (black) and clusters (red).

