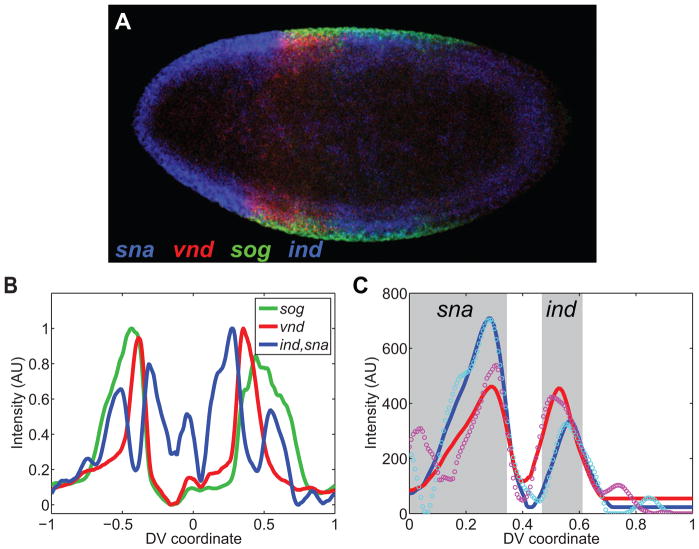
Figure 10. Quantification of gene expression profiles in a saggital section.
(A) Saggital section of F10 embryo hybridized with probes against sna (blue), vnd (red), sog (green), and ind (blue). Anterior is to the left, and posterior is to the right.
(B) Plot of the expression profiles of the genes from embryo in (A). Zero corresponds to the anterior pole (detected manually); one corresponds to the posterior pole.
(C) Fitting two canonical profiles in the same color channel. The canonical profiles of sna and ind used for this fit are specifically for F10 embryos. Cyan and magenta circles are the right and left halves of the sna/ind plot in (B), respectively. The blue and red solid curves are the fits of the canonical pattern to the measured right- and left-side patterns, respectively. The gray boxes signify the expression domains of sna and ind, separated in space.

