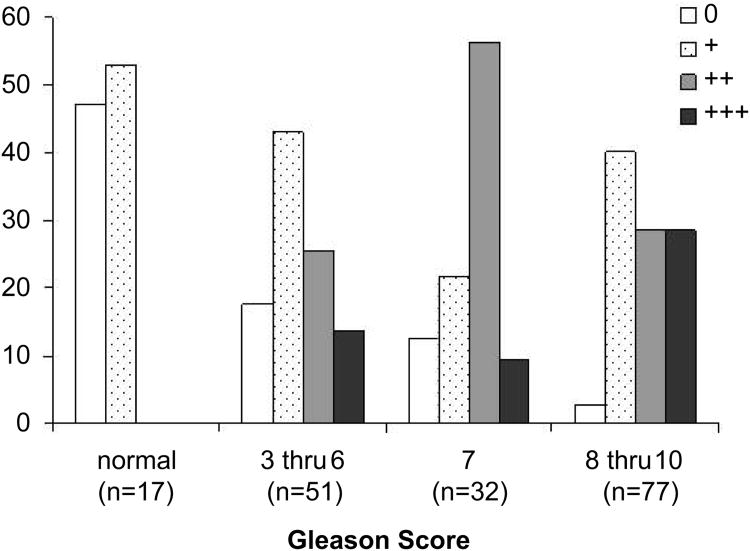
Figure 4. Relationship between Nav 1.8 staining intensity and Gleason score.
Human prostate tissue specimens consist of normal (n=17) and malignant (n=160) were analyzed by immunohistochemical staining using a polyclonal anti- Nav 1.8 antibody. Prostate tissue specimens were divided into four groups (normal, GS 3-6, GS 7, and GS 8-10) and individually scored for Nav 1.8 staining: 0 = no detectable, 1+ = low Nav 1.8 staining, 2+ = moderate Nav 1.8 staining, 3+ = strong Nav 1.8 staining.

