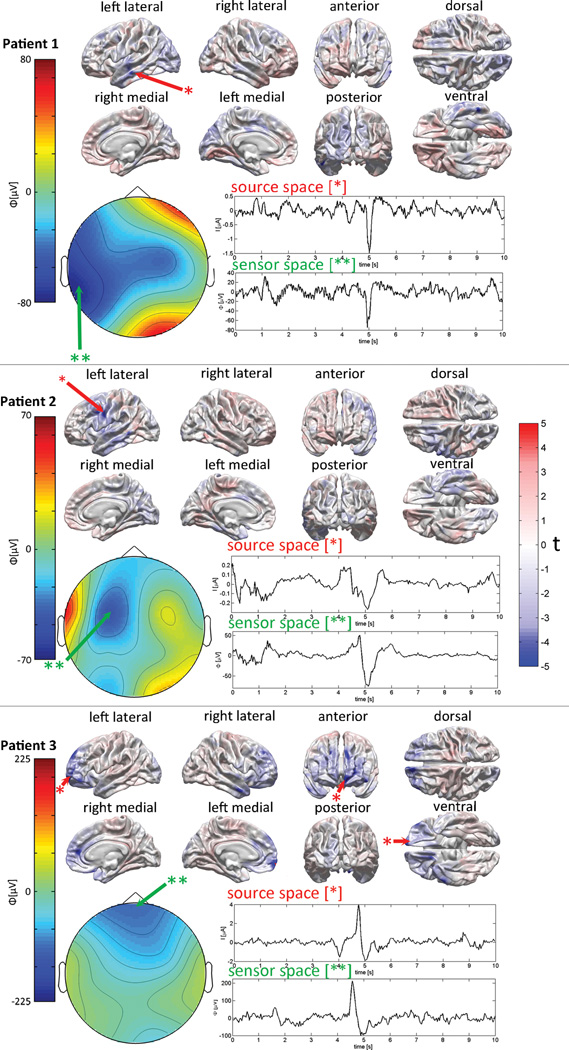
Figure 3.
Examples of inverse localization in three acute TBI patients. The localization technique is used to identify the cortical source responsible for the generation of an EEG waveform containing a large-magnitude deflection (often referred to as a “graphoelement” in the EEG literature). For each subject, the waveform of the EEG potential, Φ, being localized is shown for an interval of 10 s. Localization is illustrated at the time point with a latency of 5 s with respect to the beginning of the waveform. The EEG potentials recorded at this time point are mapped over the scalp using the interpolated values of the potentials measured at each sensor. The amplitudes of the potential Φ are measured in µV and different ranges are used for the topographic map of each subject to emphasize scalp differences in potential which are specific to each subject. The inverse estimate of the cortical activity responsible for the graphoelement is mapped onto the surface of a reference brain as t scores (see Methods section). The locations most likely to be active have |t| > 4. The sign of t indicates whether the localized electric current is oriented out of (t > 0, red hues) or into (t < 0, blue hues) the cortex. A single color map is used for t in all subjects, and color intensity indicates likelihood for the presence of electrical activity. In each subject, the scalp location which exhibits the largest negative values at a latency of 5 s is indicated by a beige arrow. Similarly, the cortical location with the most negative value of |t| corresponding to the spike generator is indicated by a red arrow. The waveform of the electric current (measured in µA) at the most likely location of each generator is depicted in addition to the sensor space waveform of the scalp potential (measured in µV).

