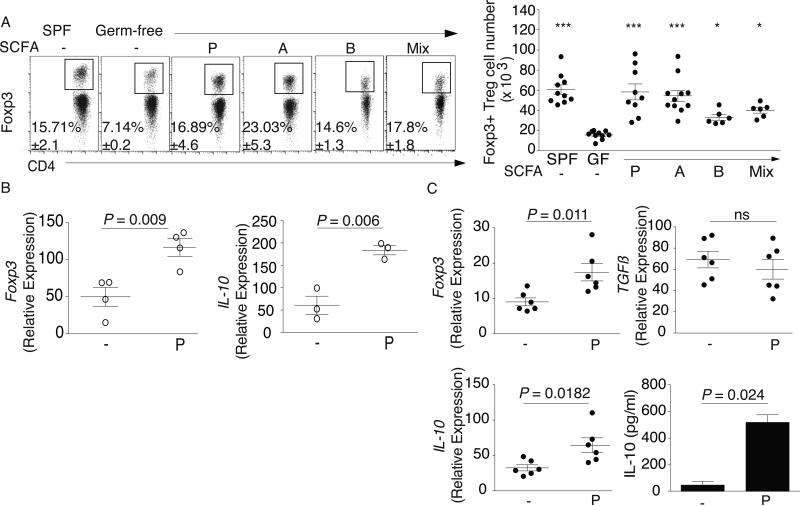
Fig. 1. SCFA restore colonic Treg populations and function in germ-free mice.
(A) Colonic lamina propria (LP) lymphocytes were isolated and stained for CD4 and Foxp3. Left panel: Representative dot plots and percentage of CD4+Foxp3+ within the CD45+CD3+ population from SPF, GF, and GF mice treated with propionate (P), acetate (A), butyrate (B), or the SCFA mix in the drinking water. Right panel: Numbers of Foxp3+ Tregs for the left panel. (B) cTregs were isolated from in vivo propionate-treated GF mice, sorted by CD4, CD127, and CD25, and examined ex vivo for expression of Foxp3 and IL-10 by RTqPCR. (C) cTregs were isolated from GF mice and purified as in 1B, cultured for 24 hrs in the presence or absence of 0.1 mM propionate and examined for expression of Foxp3, TGFβ, and IL-10 by RTqPCR and IL-10 protein production by ELISA. For panel A, symbols represent data from individual mice. Horizontal lines show the mean and error bars the SD. For panels B and C, each symbol or bar represents pooled cTregs from 3-5 mice. All data shown are representative of at least 3 independent experiments. A Kruskal-Wallis test with a Dunn's post hoc test was performed in panel A, *** P <0.001 and * P <0.05. A Mann-Whitney U test was performed in panels B and C.

