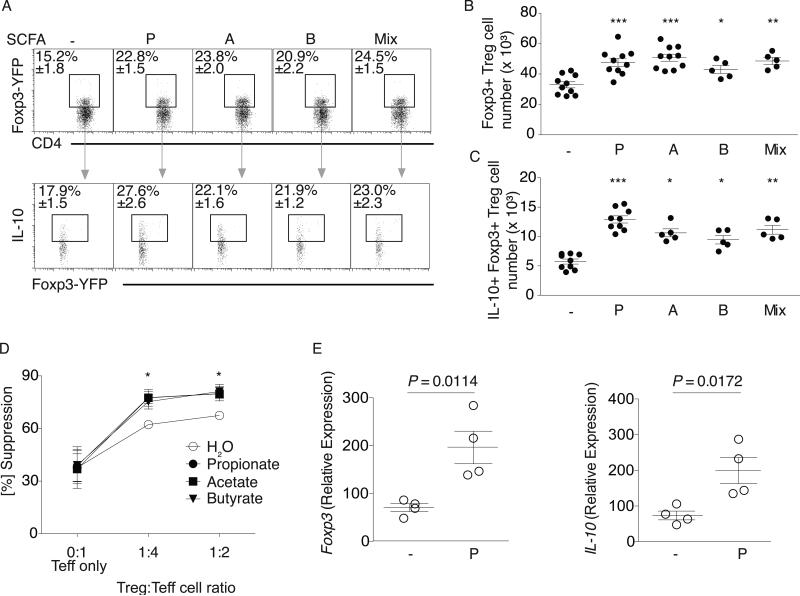
Fig. 2. SCFA augment colonic Treg population size and function in SPF mice.
(A) SPF Foxp3YFP-Cre mice were treated with water alone (-) or P, A, B, or the mix. Colonic LP lymphocytes were isolated and stained for CD4 and IL-10. Upper panel: Representative dot plots and percentage of CD4+ Foxp3-YFP+ within the CD45+CD3+ population. Lower panel: Representative dot plots and percentage of the CD4+Foxp3+IL-10+population. (B) Cell numbers for the data in (A) upper panel. (C) Cell numbers for the data in (A) lower panel. Symbols in B and C represent data from individual mice and represent 4 independent experiments. (D) cTregs were co-cultured with splenic effector T cells (Teff) and P, A, B, or media (sodium and pH matched) for 96 hrs. Percent suppression (y-axis), Treg:Teff ratios (x-axis). Symbols represent mean values and error bars SD for four independent experiments. * P < 0.01. (E) cTregs were isolated from the LP of in vivo propionate treated SPF Foxp3YFP-Cre mice, sorted for CD4 and YFP, and examined for ex vivo expression of Foxp3 and IL-10. Each symbol represents pooled cTregs from 3-5 mice, horizontal lines show the mean and error bars the SD. Four independent experiments were performed. A Kruskal-Wallis test with a Dunn's post hoc test was performed in panels B, C, D, *** P <0.0001, ** P <0.01, * P <0.05. A Mann-Whitney U test was performed for experiments in panel E and P-values are shown where significant.

