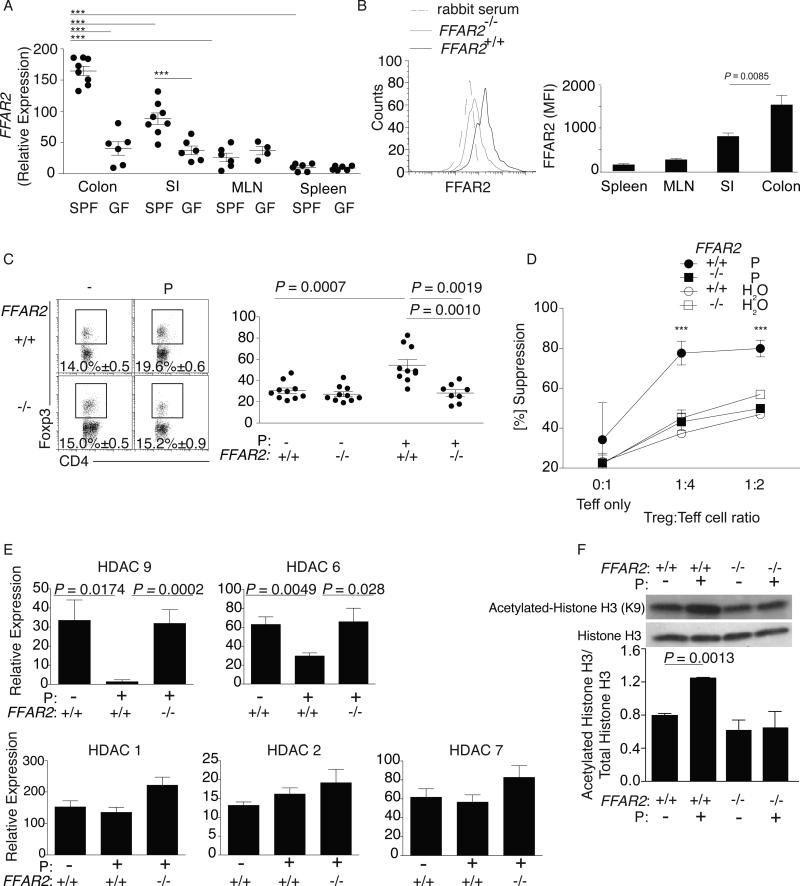
Fig 3. Ffar2 mediates SCFA effects on cTregs.
(A) Tregs were isolated from the colon, small intestine, spleen and MLN of SPF and GF BALB/c mice, purified as in 1B and Ffar2 expression examined by qPCR. Each symbol represents data from 3-5 individual mice, horizontal lines show the mean and error bars the SD. Data reflect 3-7 independent experiments. (B) Lymphocytes were isolated from the colon, small intestine, spleen, and MLN of SPF Ffar2−/− and littermate Ffar2+/+ mice. Cells were stained for CD4, Foxp3, and Ffar2. Left panel depicts a representative flow cytometry histogram comparing colonic Ffar2 expression in Ffar2−/− vs littermate Ffar2+/+ mice. Right panel shows the MFI for Ffar2 for Tregs from the indicated sites. Bars show the mean, error bars SD, and data reflect 4 independent experiments. (C) Colonic LP lymphocytes were isolated from Ffar2−/−and littermate Ffar2+/+ mice exposed to propionate (P) or water alone and stained for CD4 and Foxp3. Left panel: Representative dot plots with percentage of CD4+Foxp3+ within the CD45+CD3+ population. Right panel: Foxp3+ Treg number for the left panel. Each symbol represents data from individual mice, horizontal lines show the mean and error bars the SD. (D) Ffar2−/− and littermate Ffar2+/+ cTregs were co-cultured with splenic Teff cells in media with or without propionate for 96 hrs. Percent suppression (y-axis) and Treg:Teff ratios (x-axis). Symbols represent the mean of 3 independent experiments and error bars show the SD. (E) cTregs were isolated from the LP of Ffar2−/− and littermate Ffar2+/+ mice, purified as in 1B, cultured in the presence of 0.1 mM propionate or media (pH and sodium matched) for 24hrs and examined for expression of HDAC 1,2,6,7 and 9 by RTqPCR. Bars show the mean and error bars the SD of 3 independent experiments (F) Whole cell extracts were generated from cTregs isolated from the LP of Ffar2−/− and littermate Ffar2+/+ mice, purified as in 1B, and cultured in the presence of 0.1 mM propionate or media (pH and sodium matched) for 24hrs. Samples were analyzed by western blotting for histone acetylation by examining levels of acetylated histone (H3K9), total histone levels were used as a loading control. The western blot shown is representative of two independent experiments with cTregs cell lysates pooled from 10-12 mice per group. A bar graph of densitometry ratios of acetylated Histone H3:total Histone H3 is shown. Bars represent the mean and error bars the SD. A Kruskal-Wallis test with a Dunn's post hoc test was performed for panels A and D, *** P < 0.001. The Mann-Whitney U test was performed for panels C and E. The student's t-test was performed for panel B and F.

