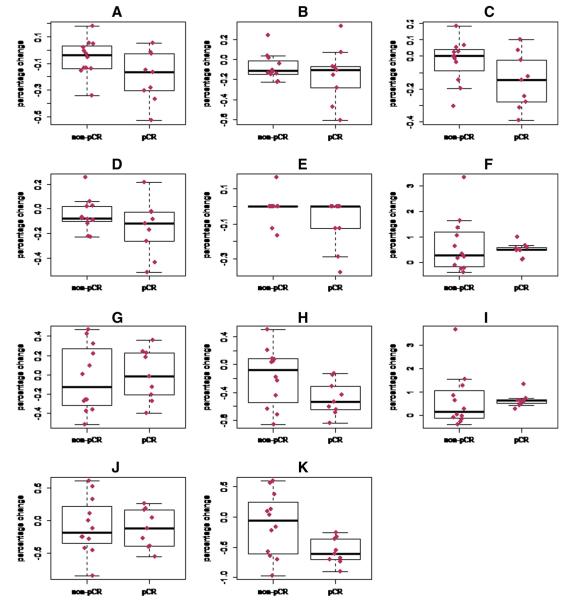
Fig 3.
Box plots illustrating percentage changes from baseline to post-cycle 1 for all imaging parameters, stratified by pathological response. (A) Lesion size, long axis, early in enhancement. (B) Lesion size, short axis, early in enhancement. (C) Lesion size, long axis, late in enhancement. (D) Lesions size, short axis, late in enhancement. (E) Radiologists’ subjective assessment of lesion enhancement, graded in quartiles (see text). (F) Percentage of voxels exhibiting progressive (Type I) enhancement kinetics with a ≥50% enhancement filter. (G) Percentage of voxels exhibiting plateau (Type II) kinetics with a ≥50% enhancement filter. (H) Percentage of voxels exhibiting washout (Type III) kinetics with a ≥50% enhancement filter. (I) Percentage of voxels exhibiting progressive (Type I) kinetics with a ≥100% enhancement filter. (J) Percentage of voxels exhibiting plateau (Type II) kinetics with a ≥100% enhancement filter. (K) Percentage of voxels exhibiting washout (Type III) kinetics with a ≥100% enhancement filter. pCR = pathological complete response.

