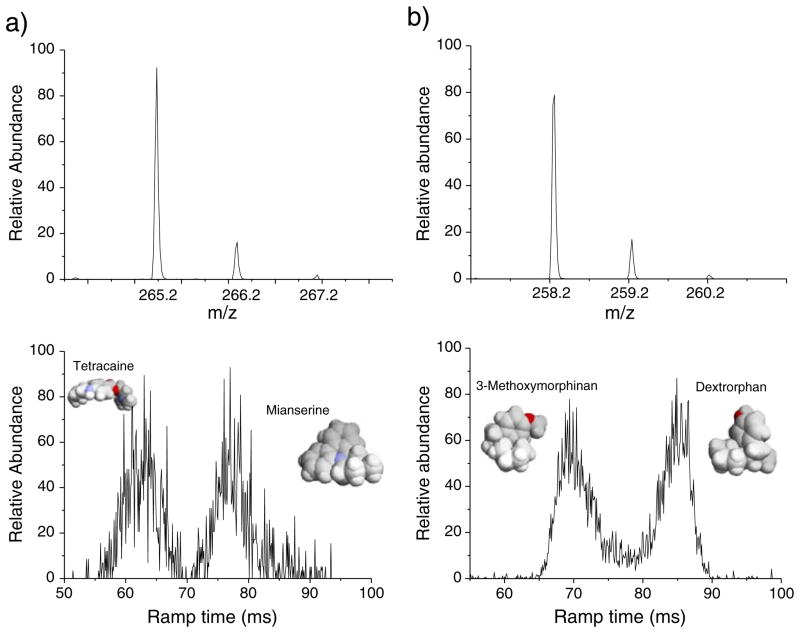
Fig. 2.
ToF spectra and IMS profiles obtained using a TIMS device for isobar mixtures. a Tetracaine (C15H24N2O2, [M+H]+ m/z=265.183) and Mianserine (C18H20N2, [M+H]+ m/z=265.162), and b 3-Methodymorphinam(C17H23NO, [M+H]+ m/z=258.177) and Dextrorphan(C17H23NO, [M+H]+ m/z=258.177). Isotopic distributions are shown in the MS spectra (top) while baseline mobility separation is obtained (bottom). In the insets, representation of the isobar pairs 3D structure, color by the element type

