
Figure 2. Adrenergic alpha 1, alpha 2 and beta receptor mRNA levels in the exercise control group.
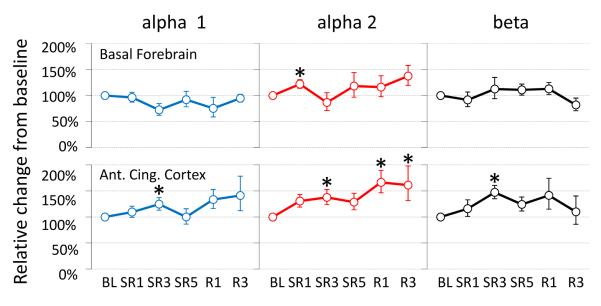
The brain tissue was collected at the light onset following the 30 min-on and 90 min-off cycle of sleep deprivation wheel rotation. The time course of changes (mean ± s.e.m.) show no specific patterns. The asterisk (*) indicates statistical significance (P < 0.05, N=7~8) compared to the baseline (BL).