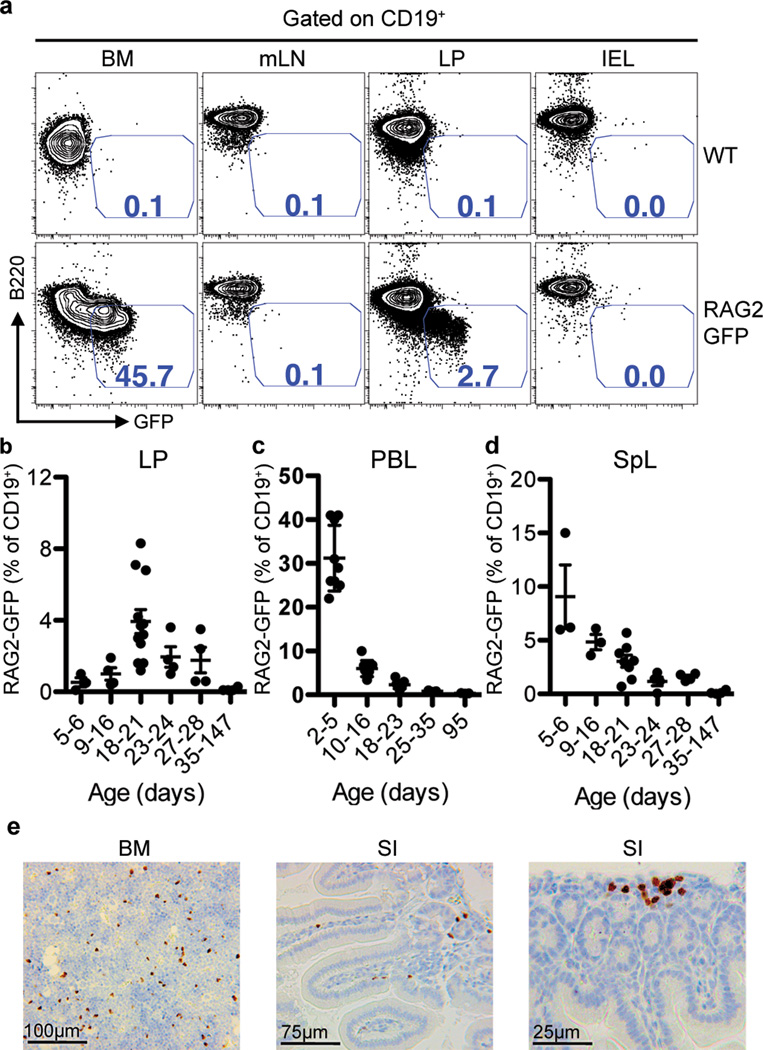
Figure 1. Gut LP RAG2+ B Lineage Cells in Weanling Age Mice.
a, FACS plots of CD19+ cells from the indicated tissues taken from wild type (WT) (top) or homozygous Rag2-Gfp knock-in (bottom) mice. B220 expression is plotted against GFP fluorescence. Numbers denote percentage of CD19+ B220low RAG2-GFP+ cells. b–d, dot plots showing percentage of RAG2-GFP+ cells in listed tissues from indicated post-natal ages. Each point represents one mouse. Horizontal bars indicate mean values ± s.e.m. e, Immunohistochemistry of paraffin-embedded sections from bone marrow (BM) and small intestine (SI) stained with an anti-TdT antibody. Dark brown indicates TdT-reactivity.

